City Nature Challenge 2024 Results
From the California Academy of Sciences:
City Nature Challenge records 2.4 million wildlife observations from more than 83,000 participants in a single weekend
Data from community scientists across the globe informs species conservation, enhances understanding of global biodiversity
Now in its ninth year, the annual City Nature Challenge (CNC) global bioblitz has concluded, yielding more than 2,400,000 wildlife observations for another record-breaking year. Over the four-day event, held between April 26-29, more than 83,000 people across six continents used the free mobile app iNaturalist to participate however they could—including attending community wildlife surveys and observing species in their own homes—to document the wondrous diversity of wild plants, animals, and fungi that share our planet. From observations of critically endangered and elusive species to sightings outside of known species ranges, information collected during the City Nature Challenge underscores the value of community science to track real-time changes in our planet’s biodiversity—especially in urban areas.
Local observation makes the news! The California Academy of Sciences included this incredible iNaturalist observation of a Bobcat by John Hartgerink at Bluebonnet Swamp Nature Center in their press release.
Baton Rouge Region Results
April 26-29, 2024
17,511
Observations Made
#33 in the world out of 690 cities
#14 in the USA out of 134 cities
2,703
Species Documented
#19 in the world out of 690 cities
#10 in the USA out of 134 cities
382
People Participated
#52 in the world out of 690 cities
#31 in the USA out of 134 cities
View the iNaturalist observations that participants made for the Baton Rouge Region
Louisiana Results
#1 Baton Rouge Region
#2 Southwest Louisiana Region
#3 New Orleans Region
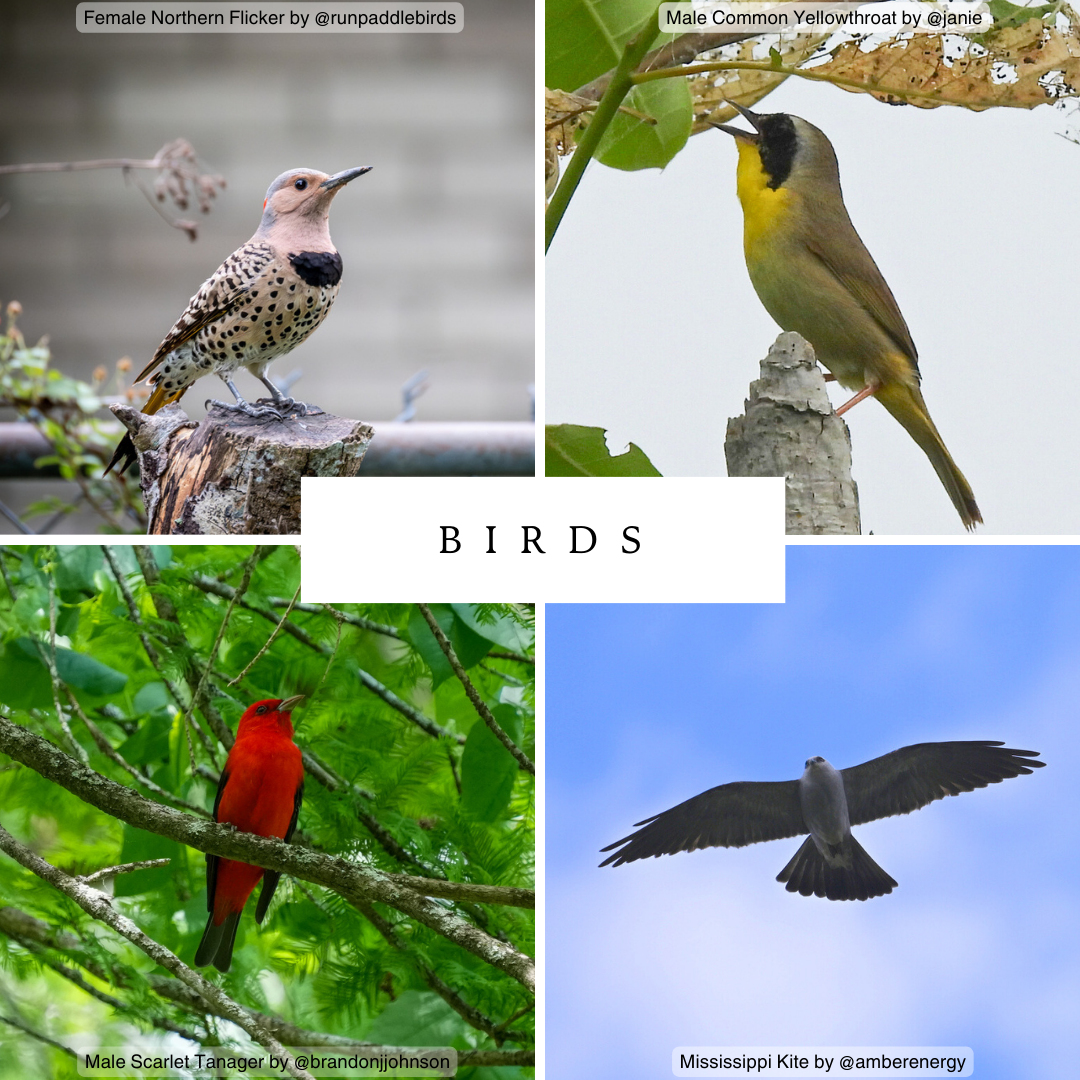
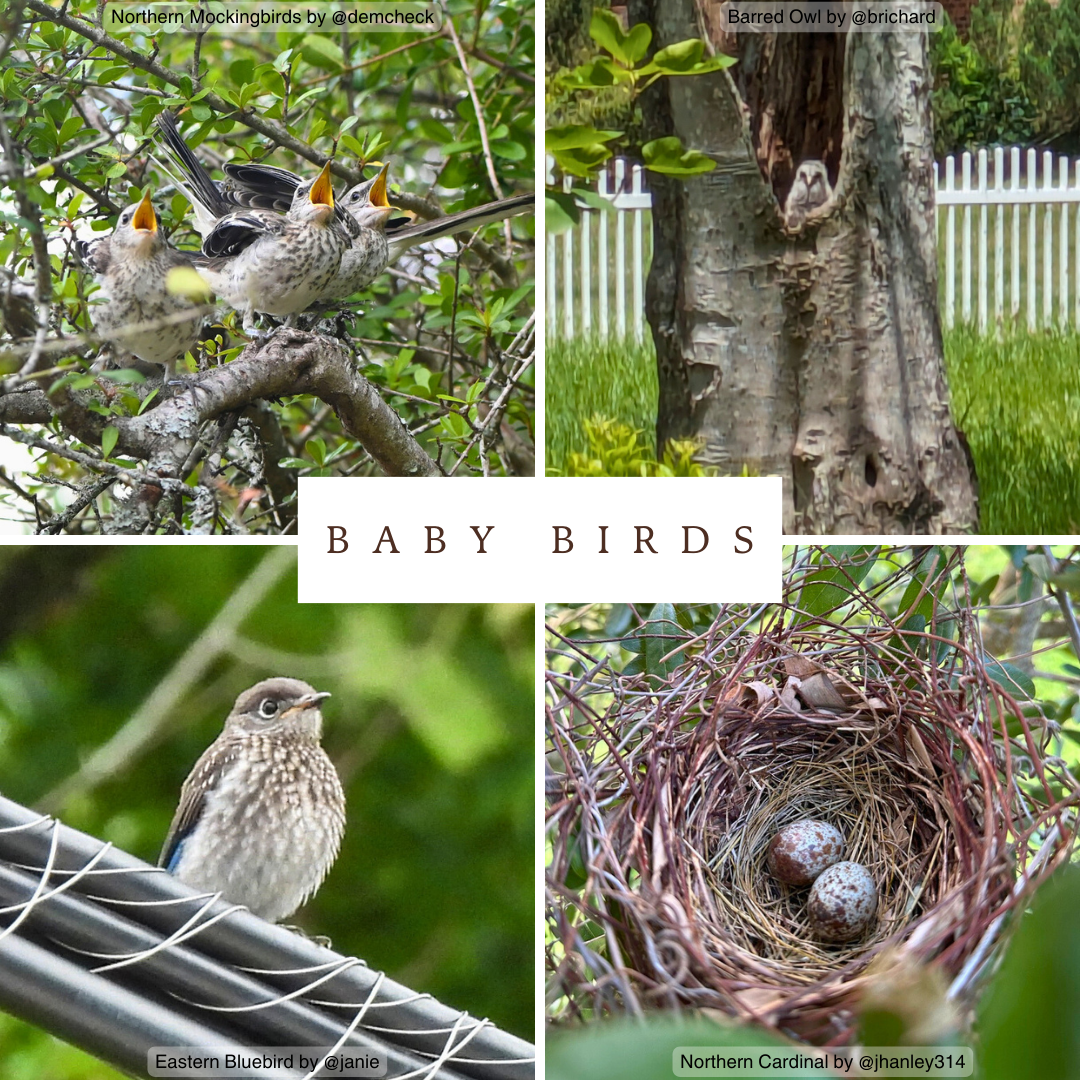
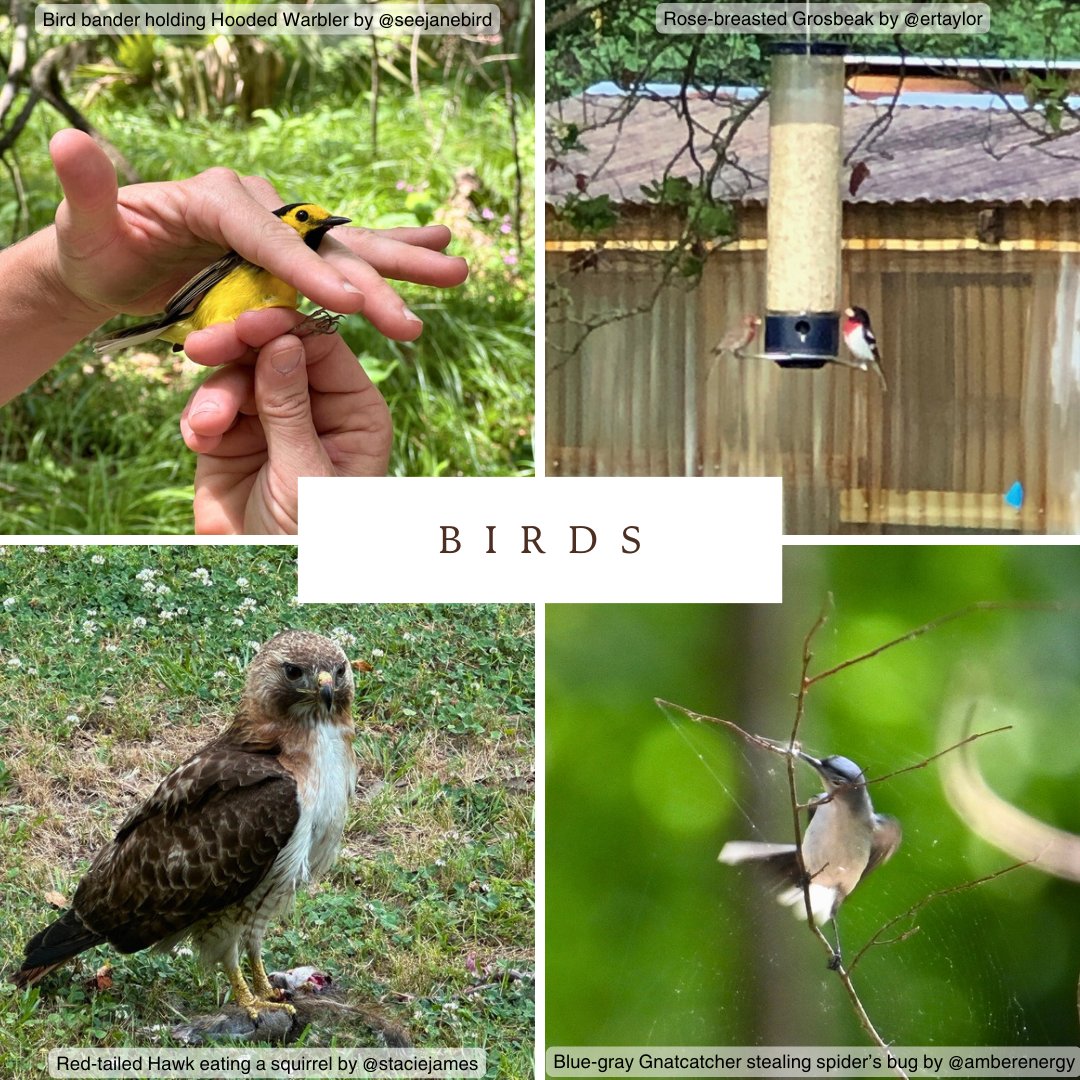
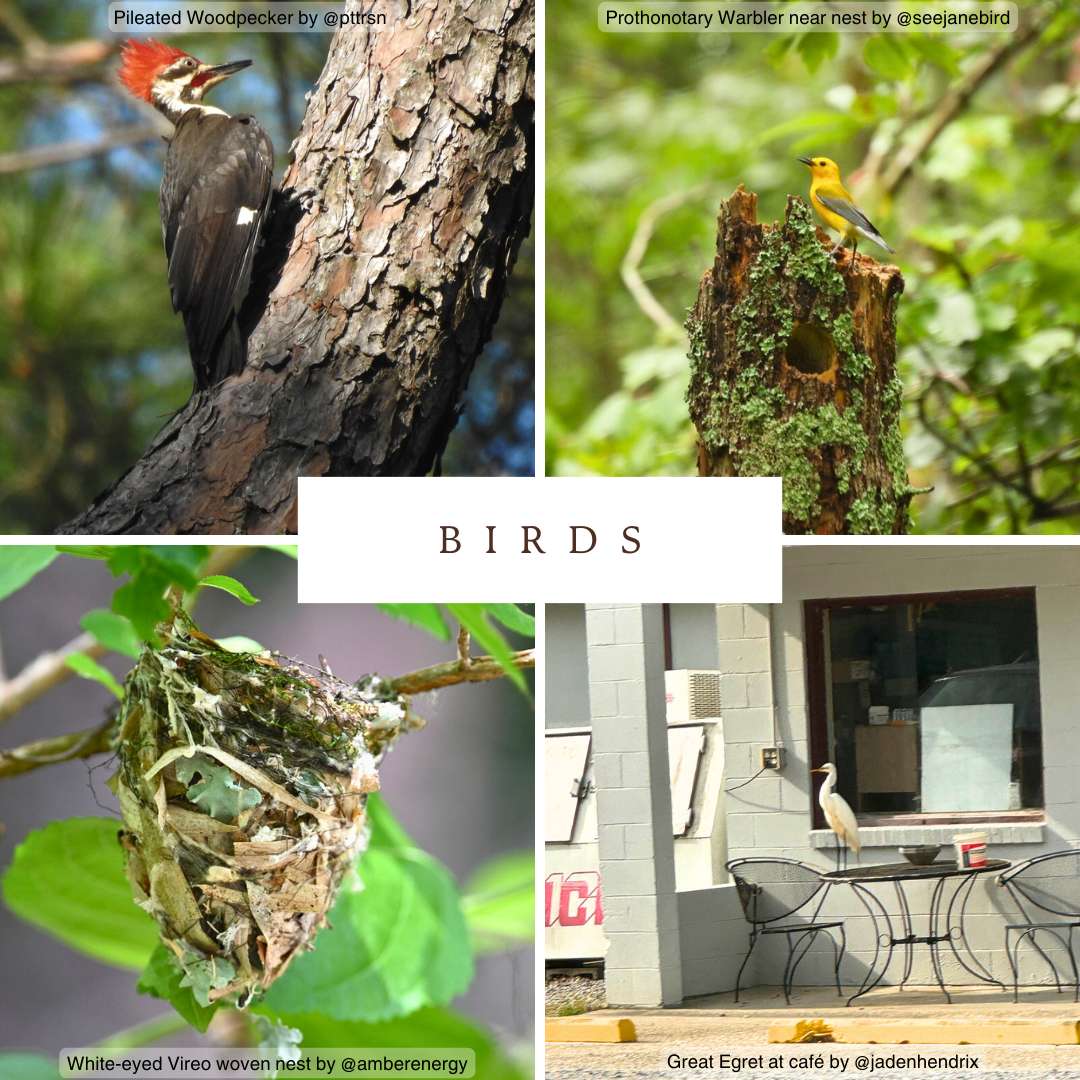
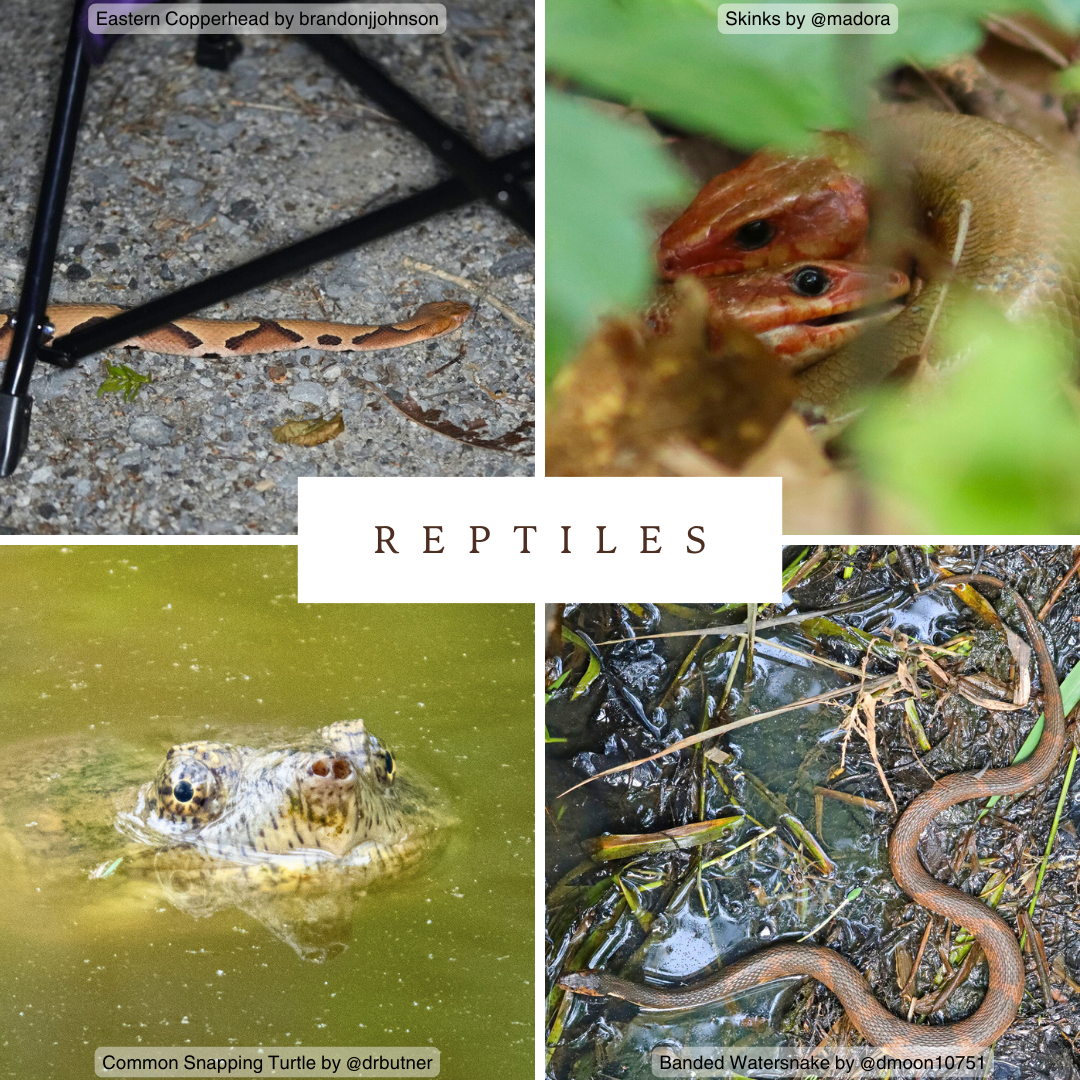
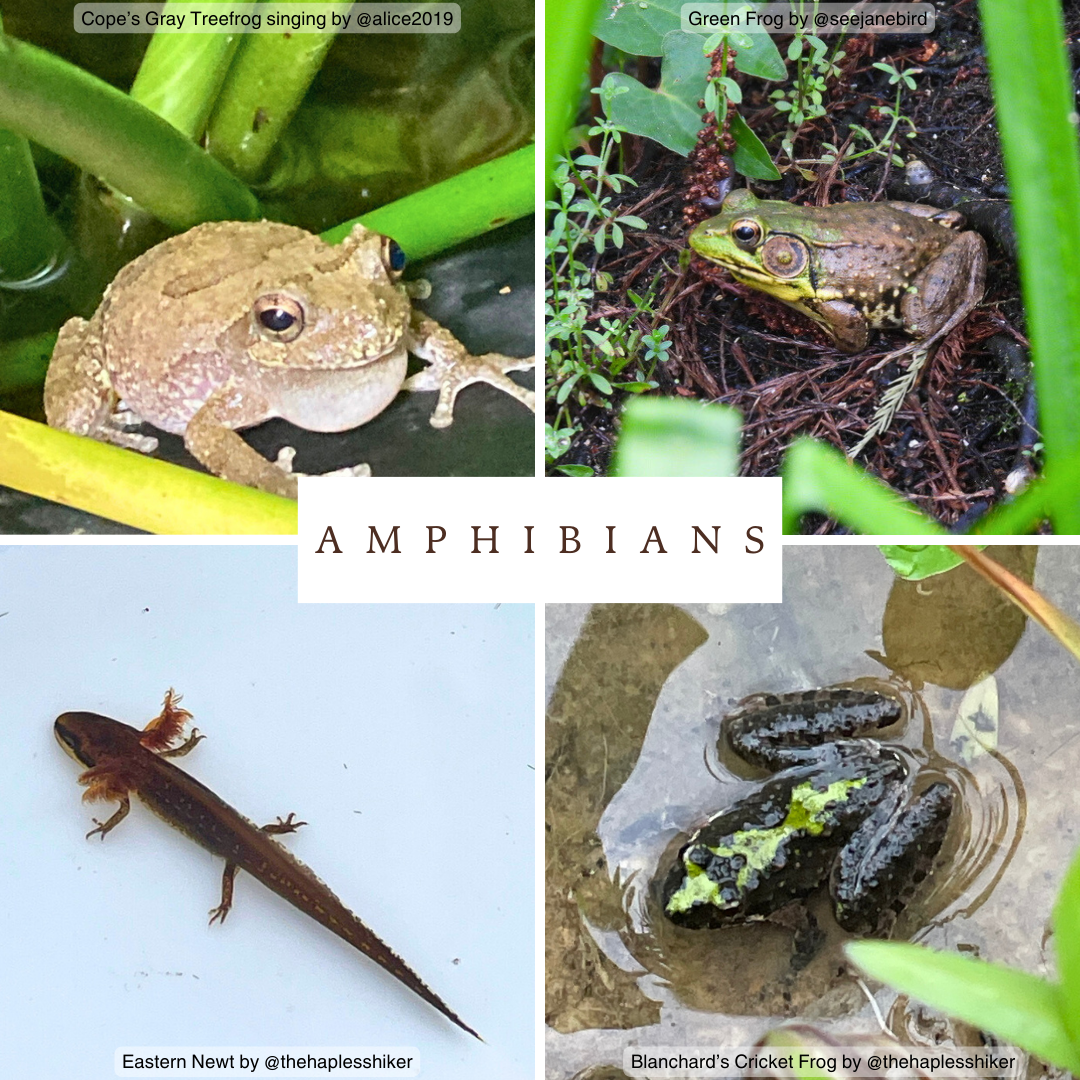
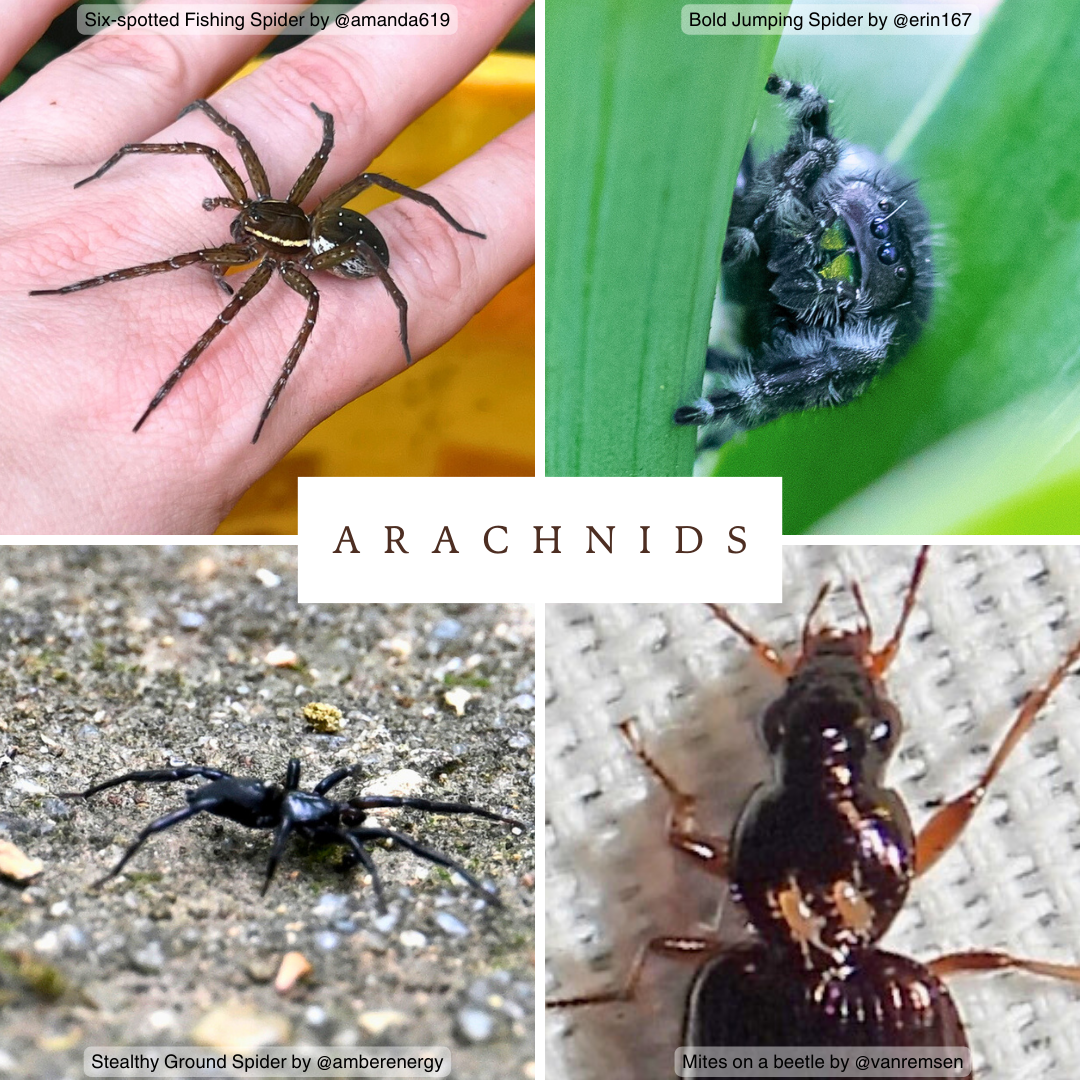
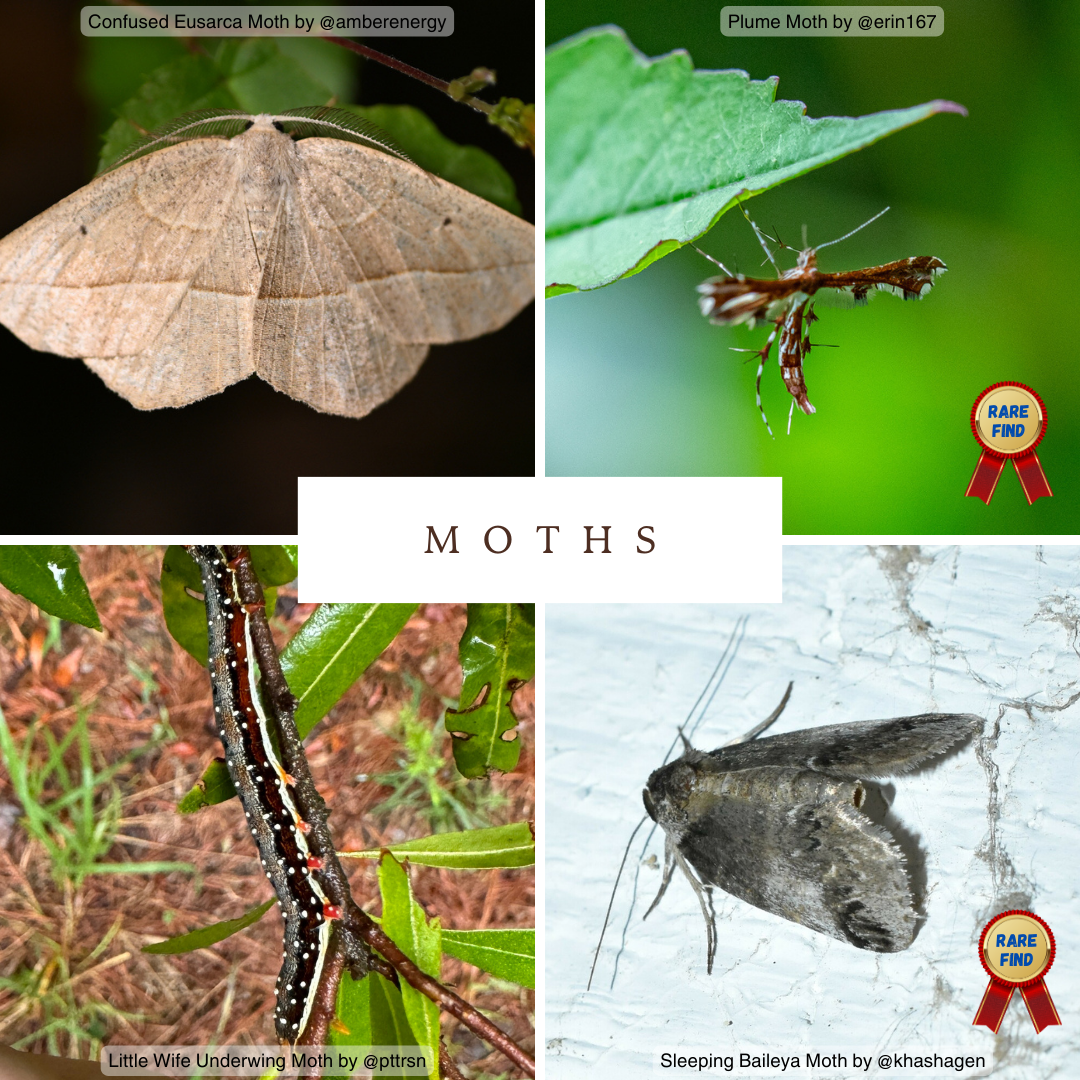
Baton Rouge City Nature Challenge 2024 Fun Finds
Selected by the Louisiana Master Naturalists of Greater Baton Rouge
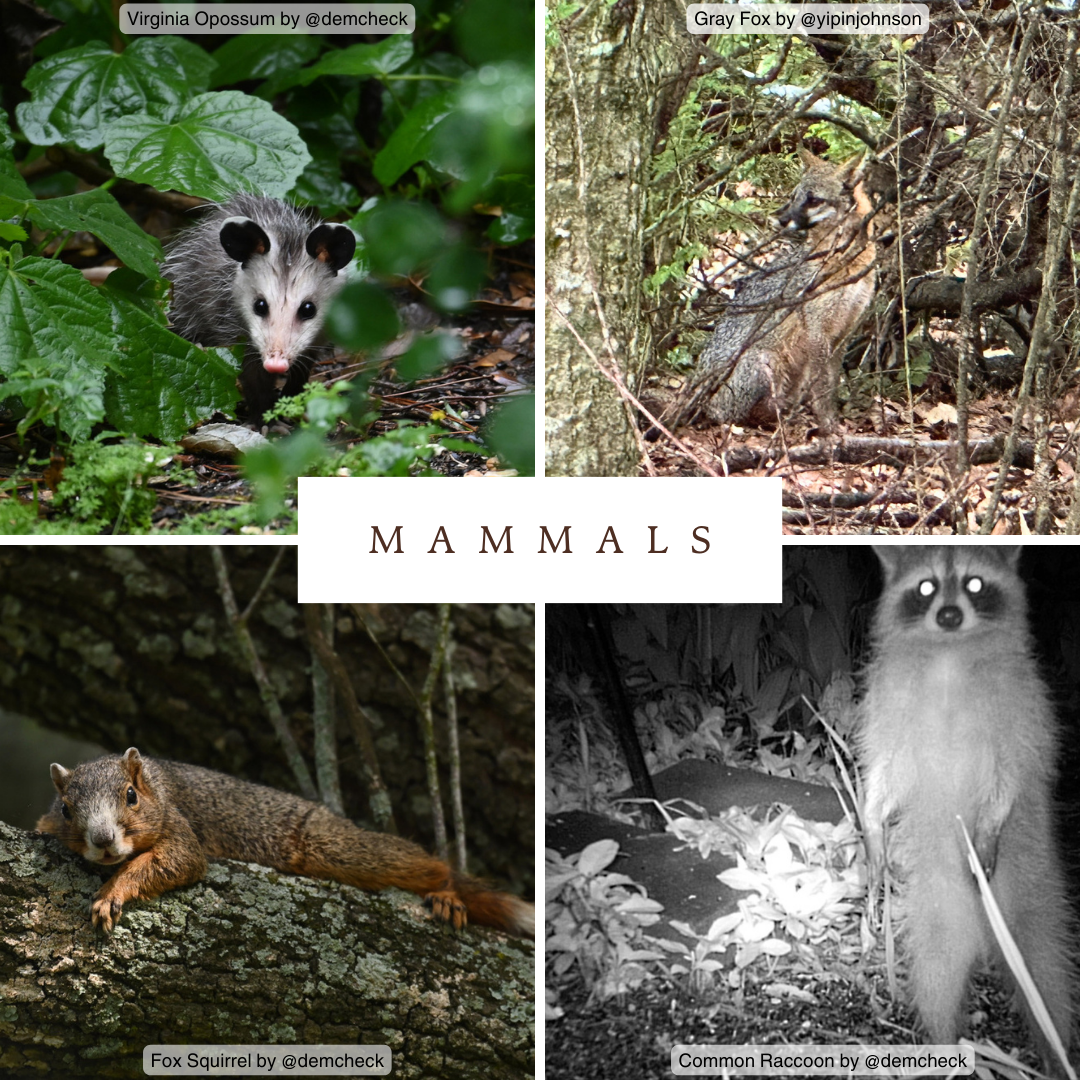
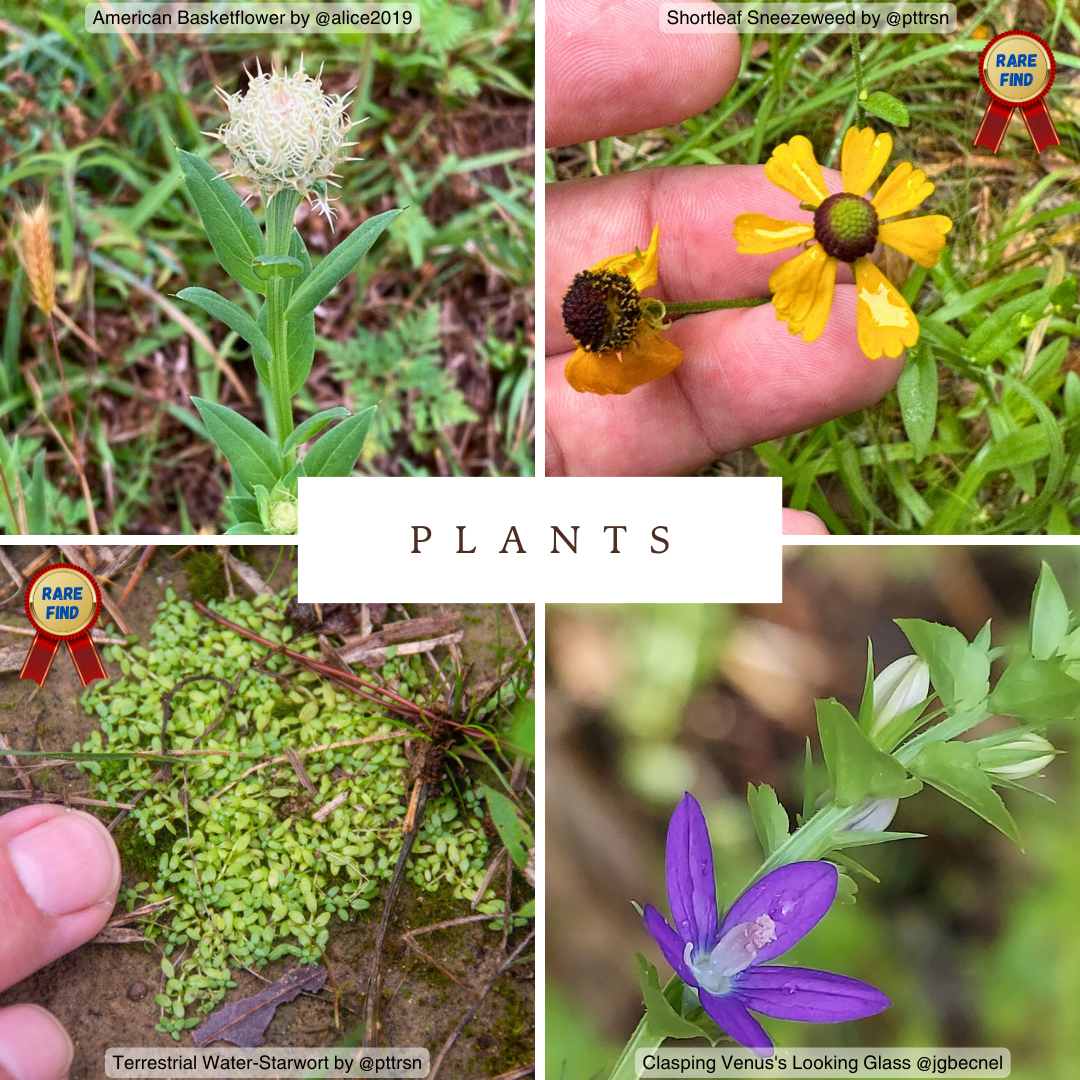
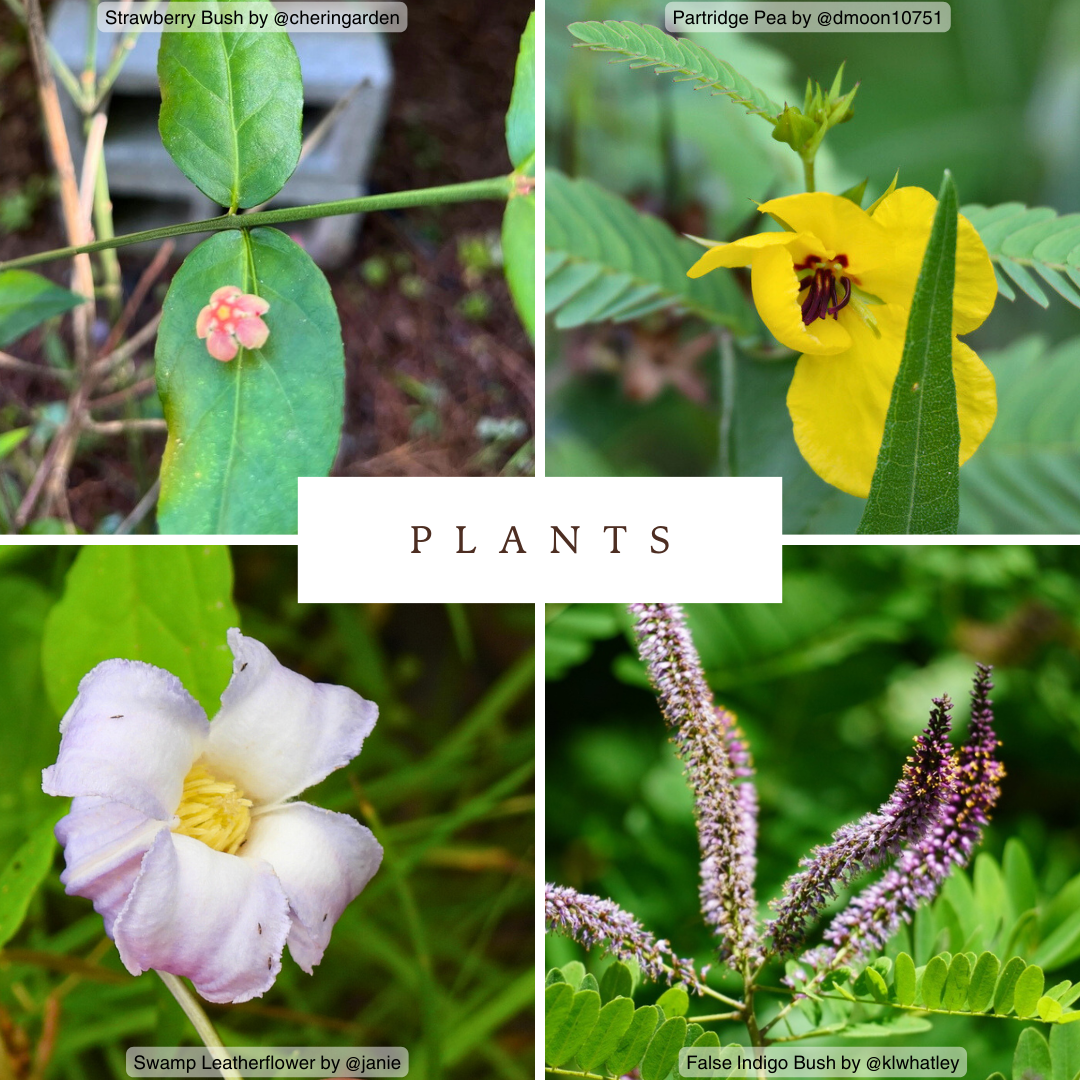
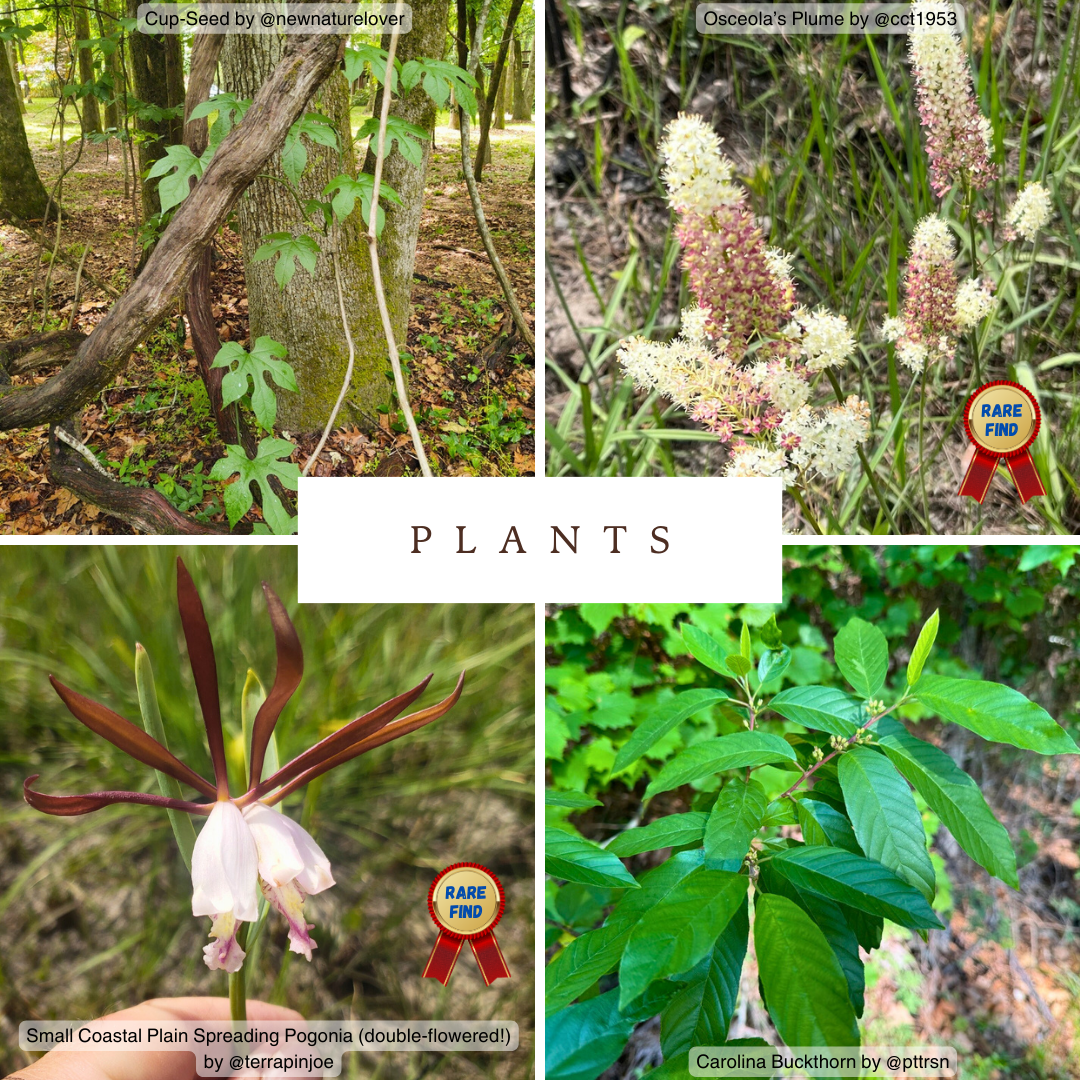
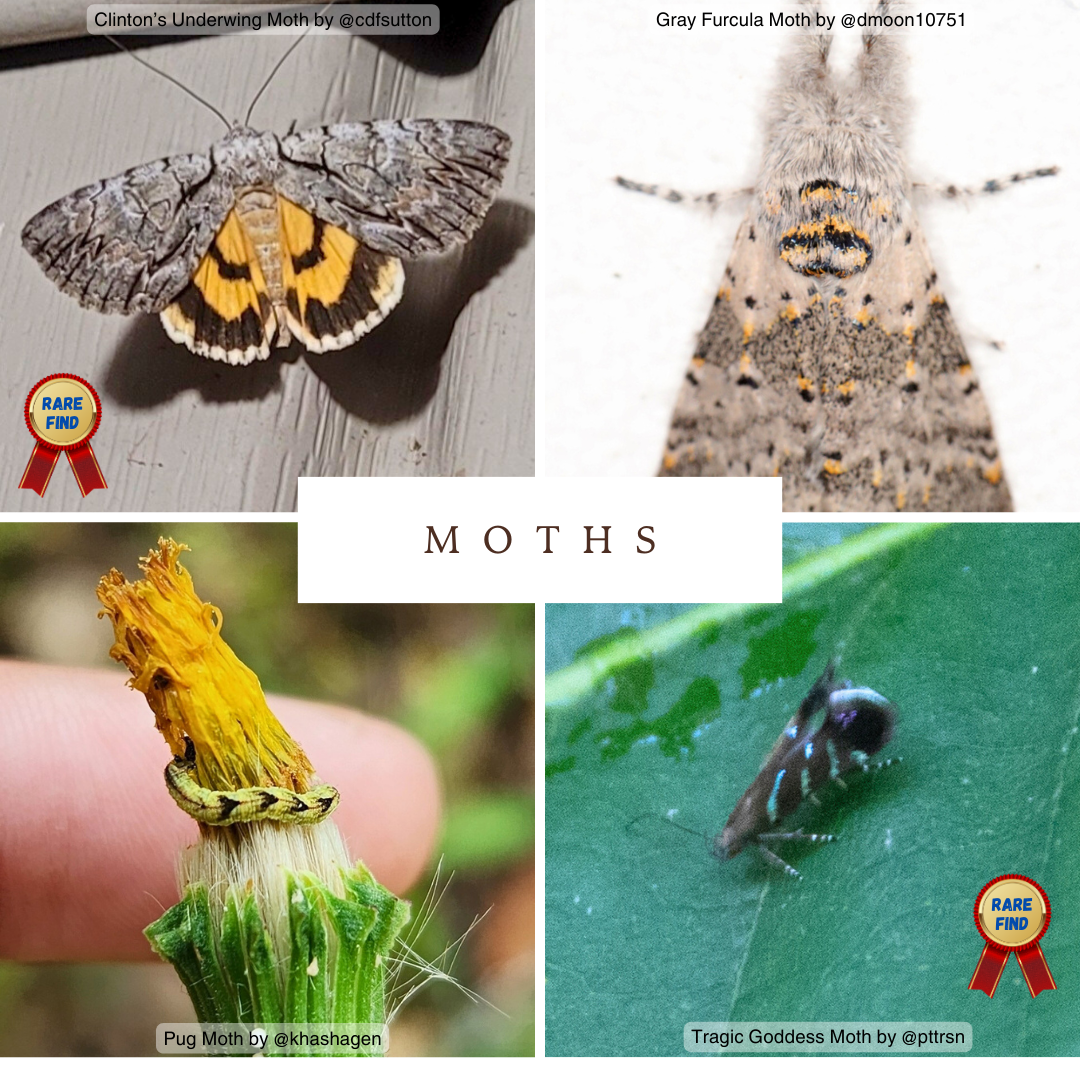
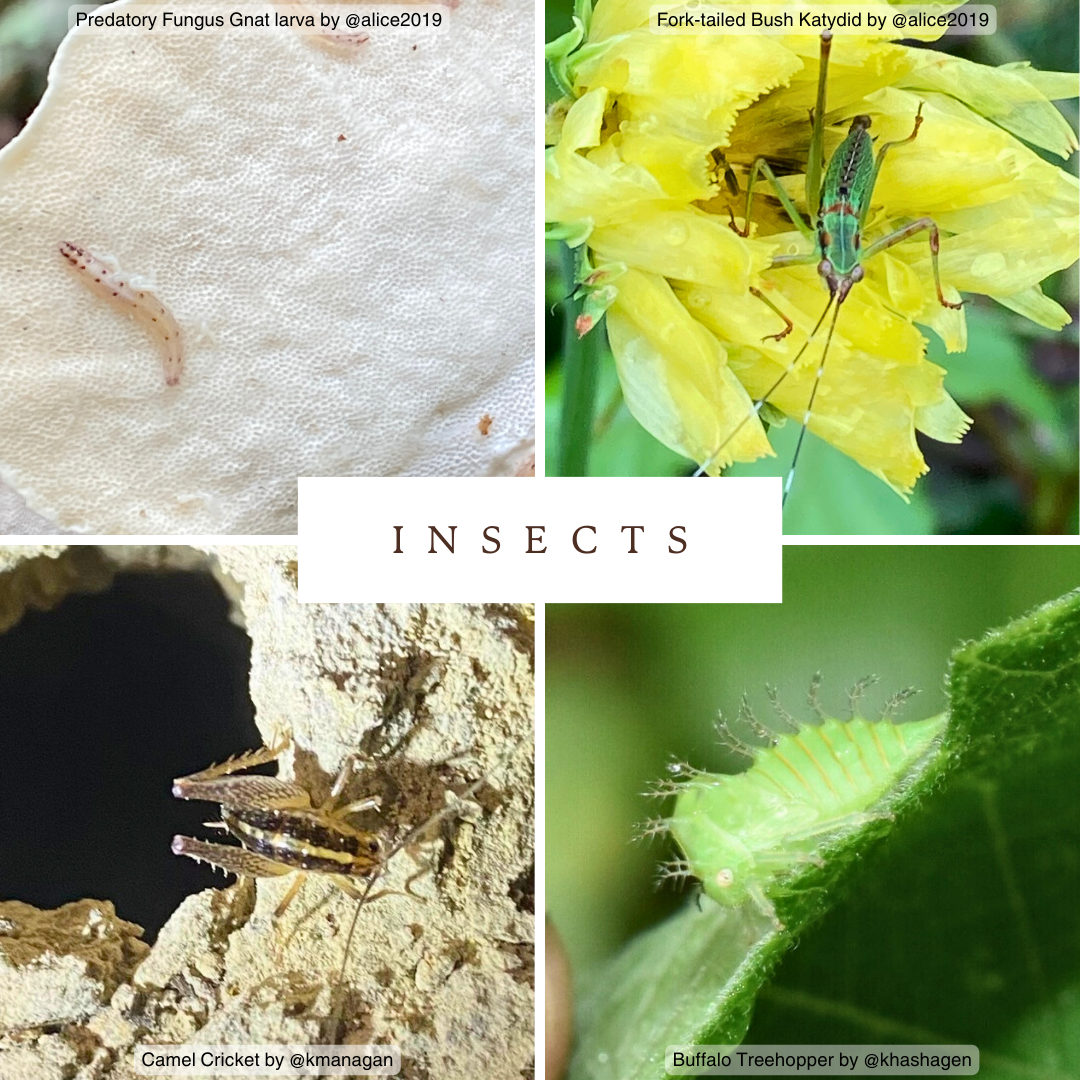
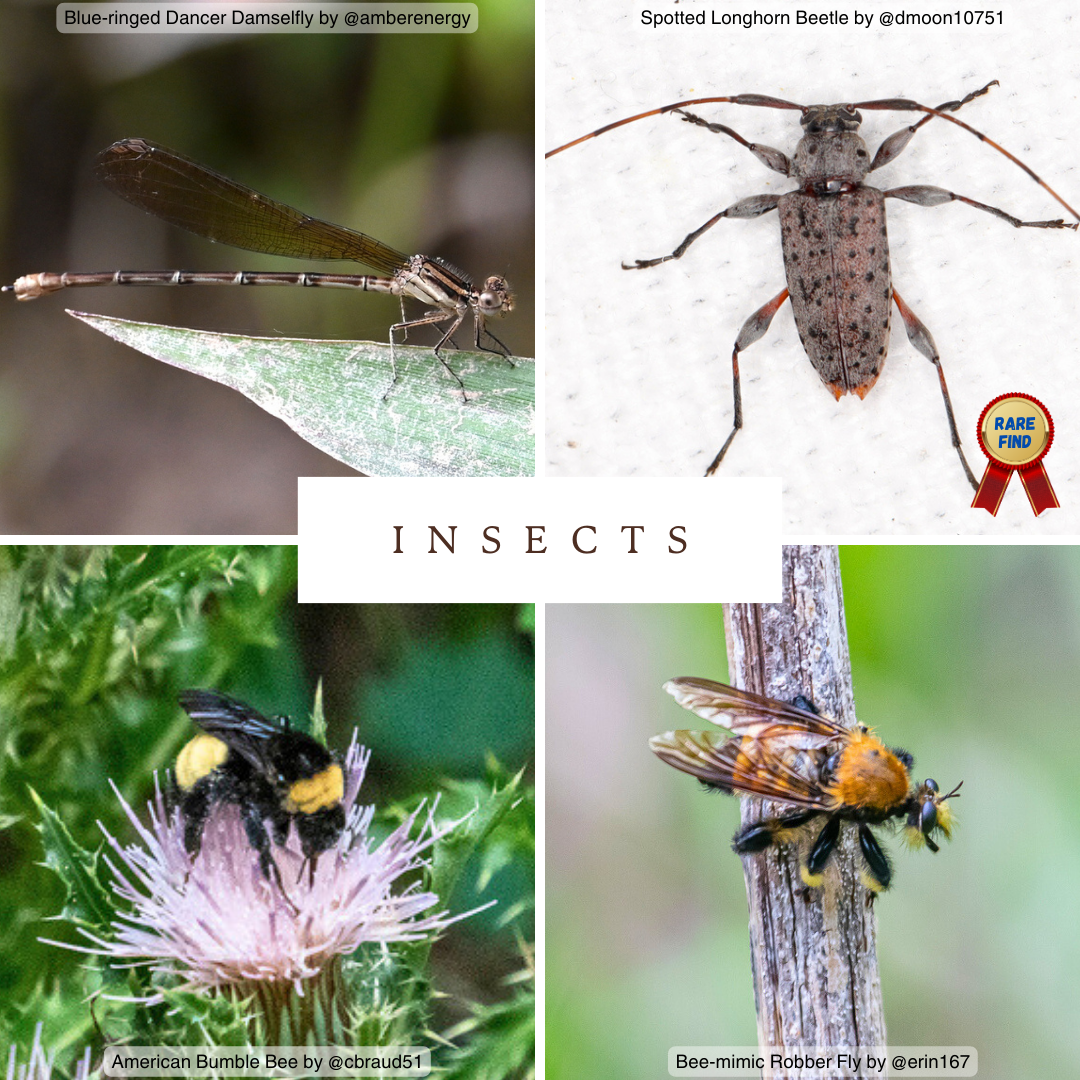
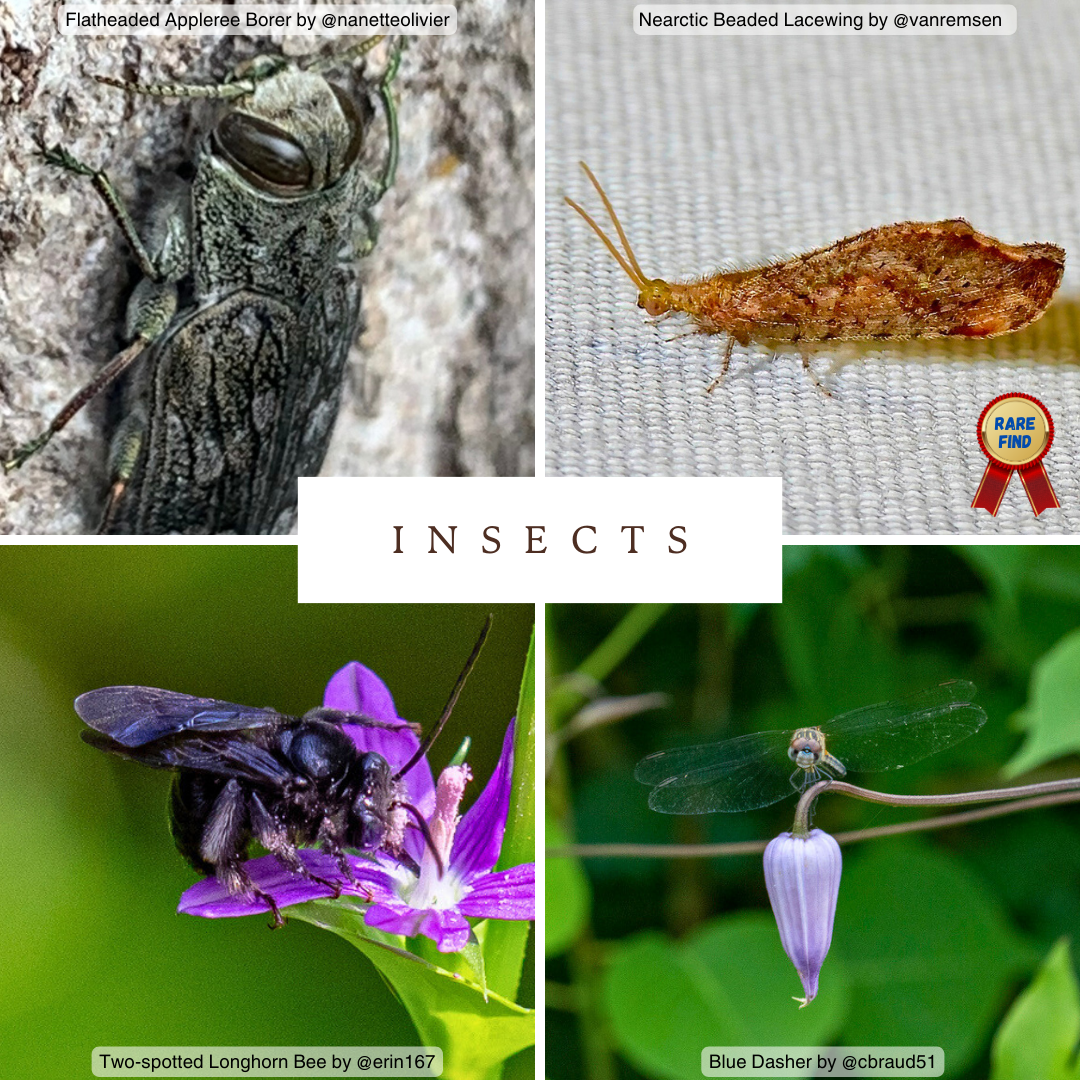
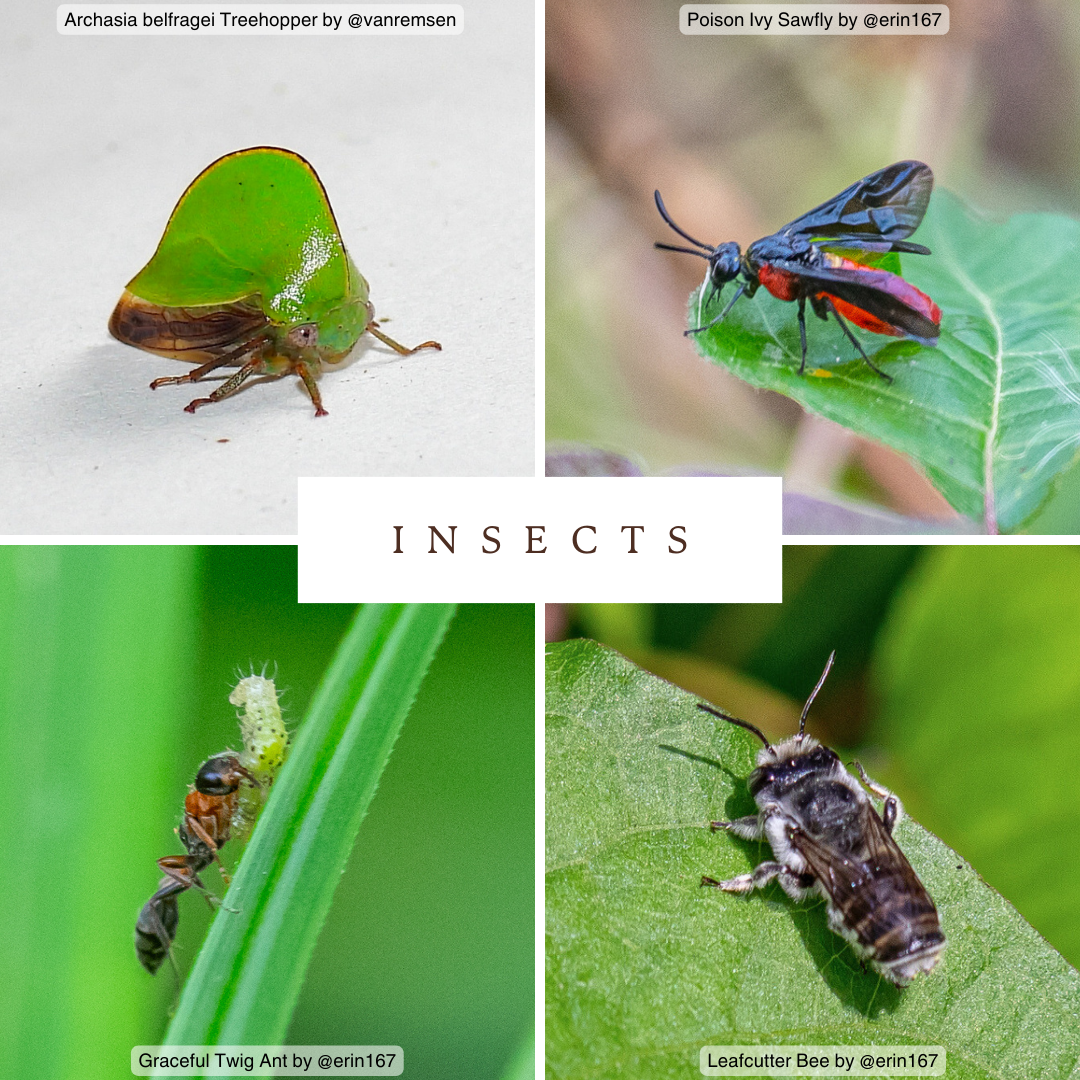
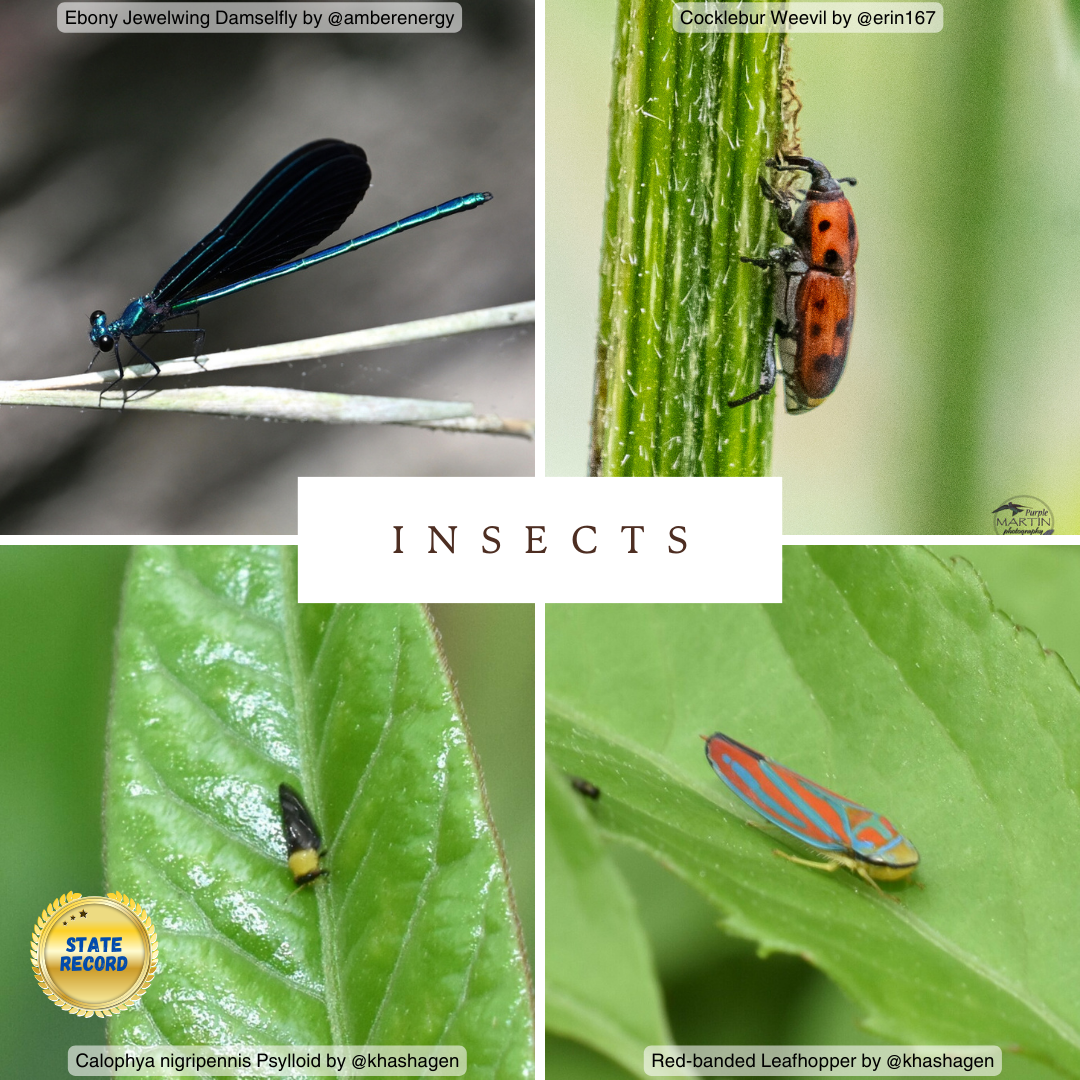
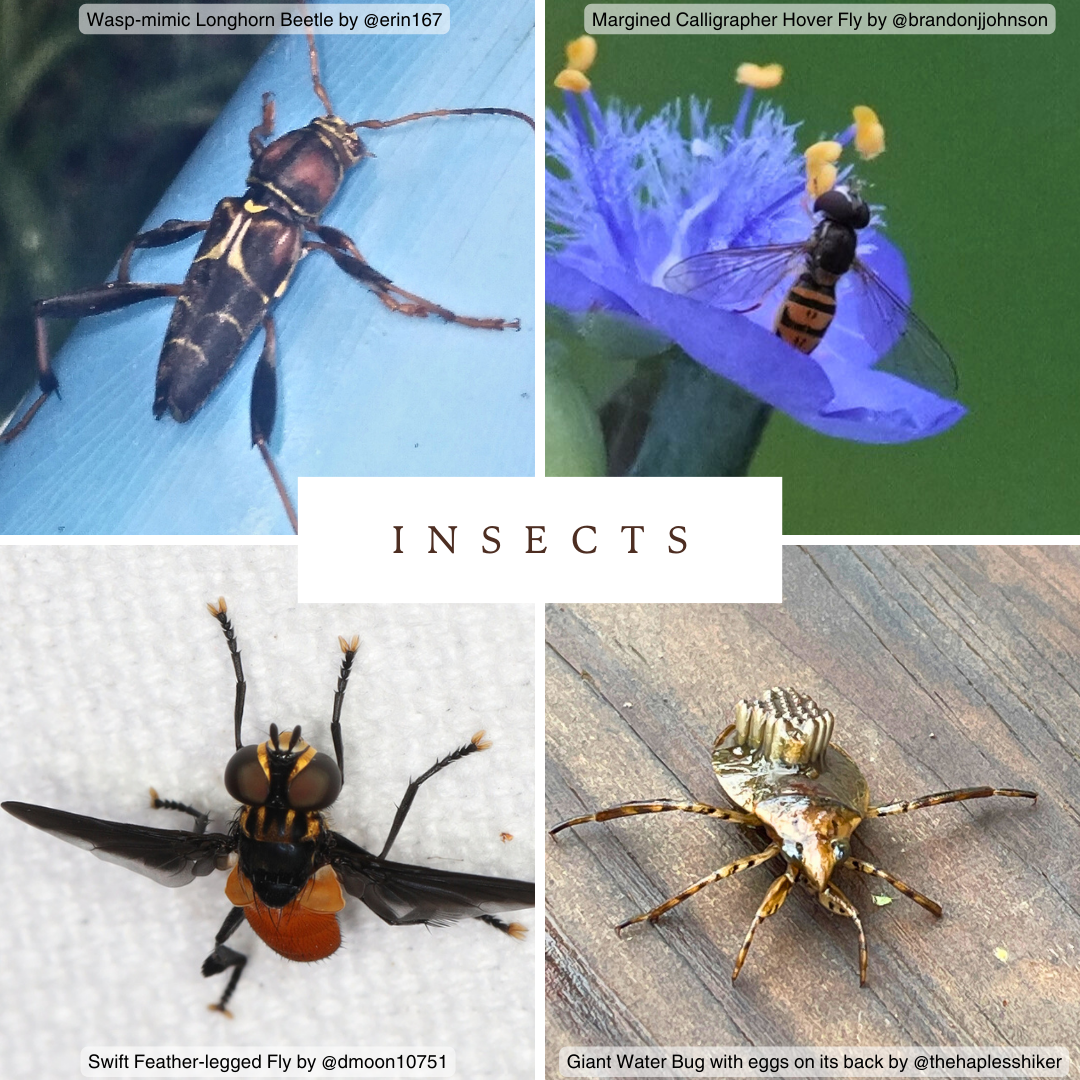
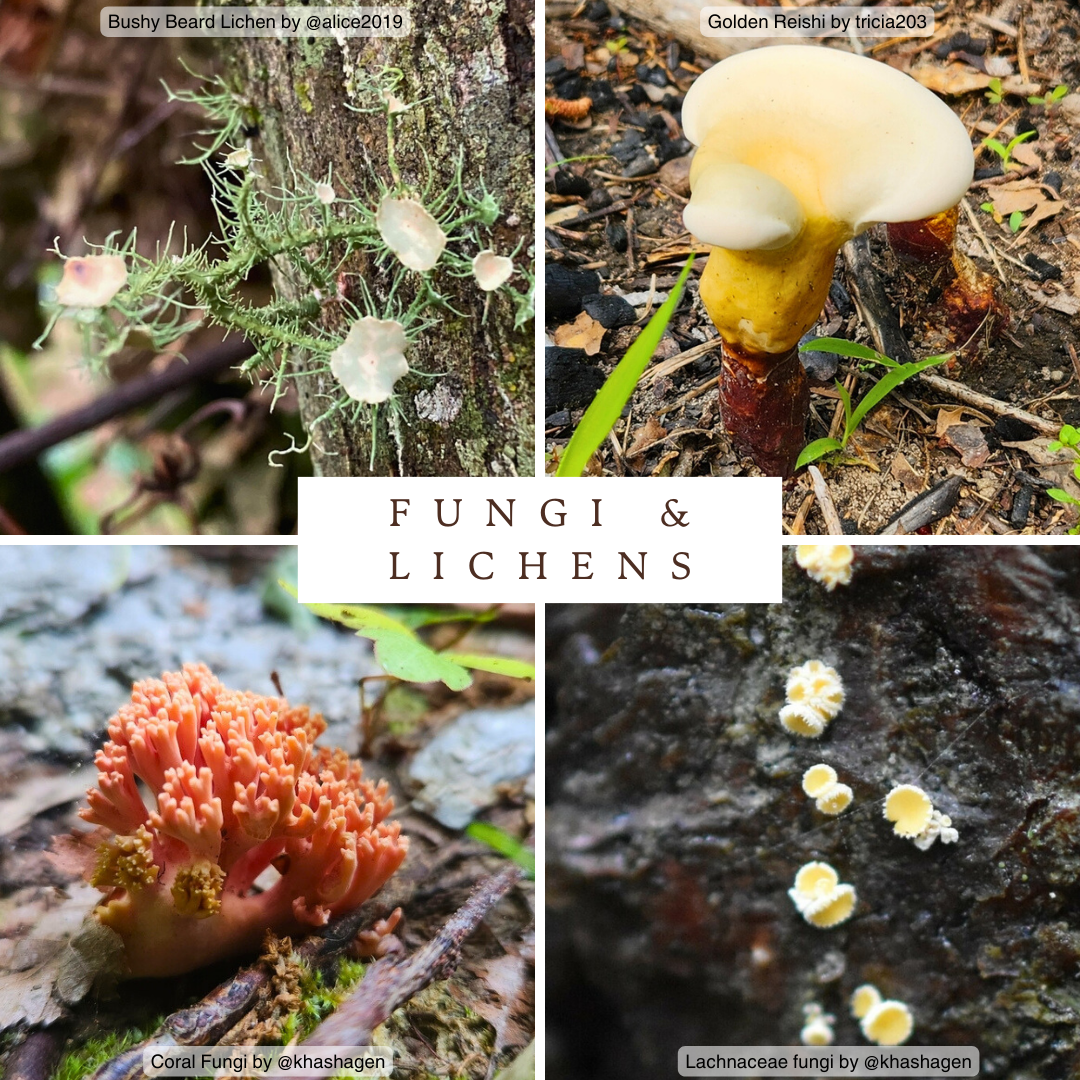
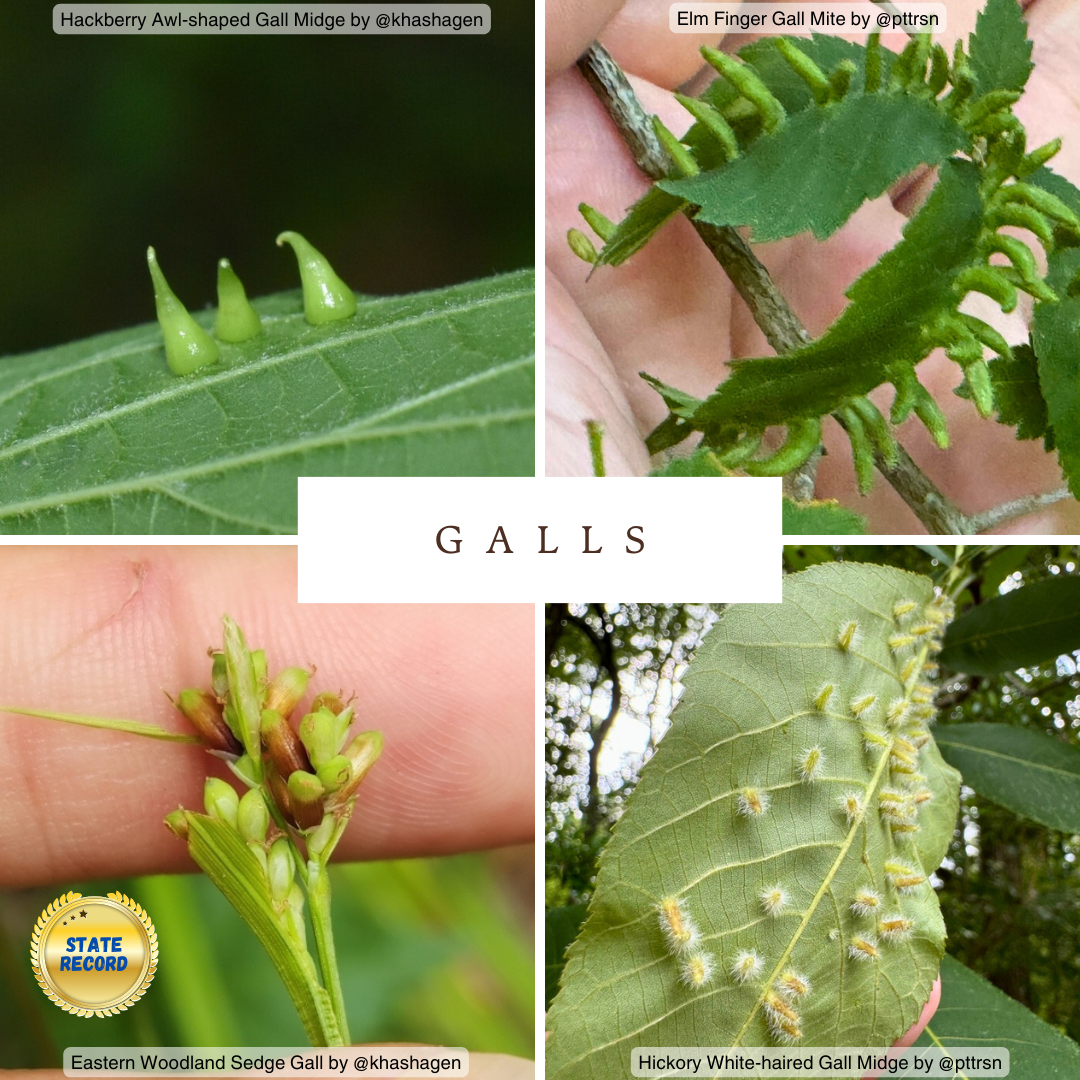
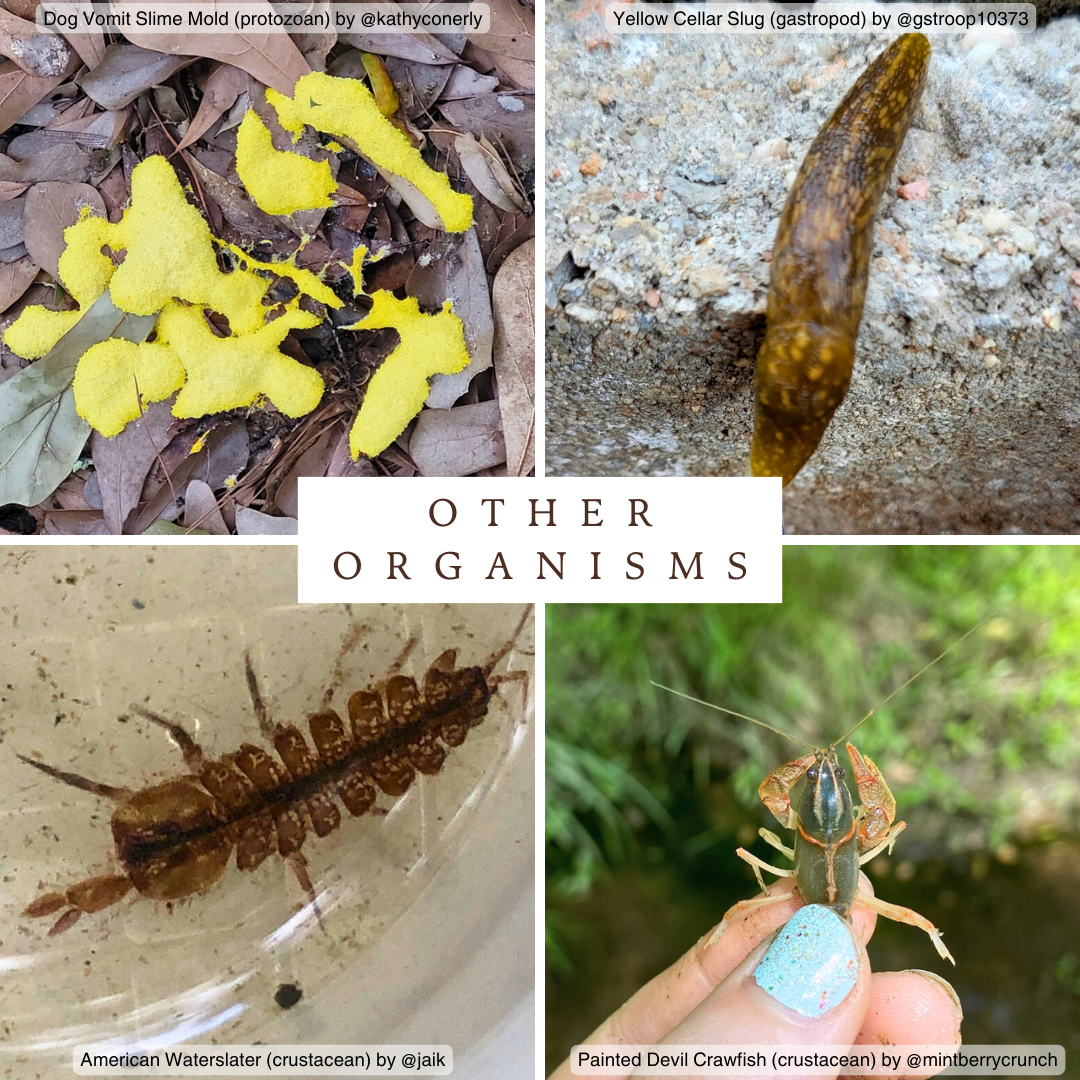
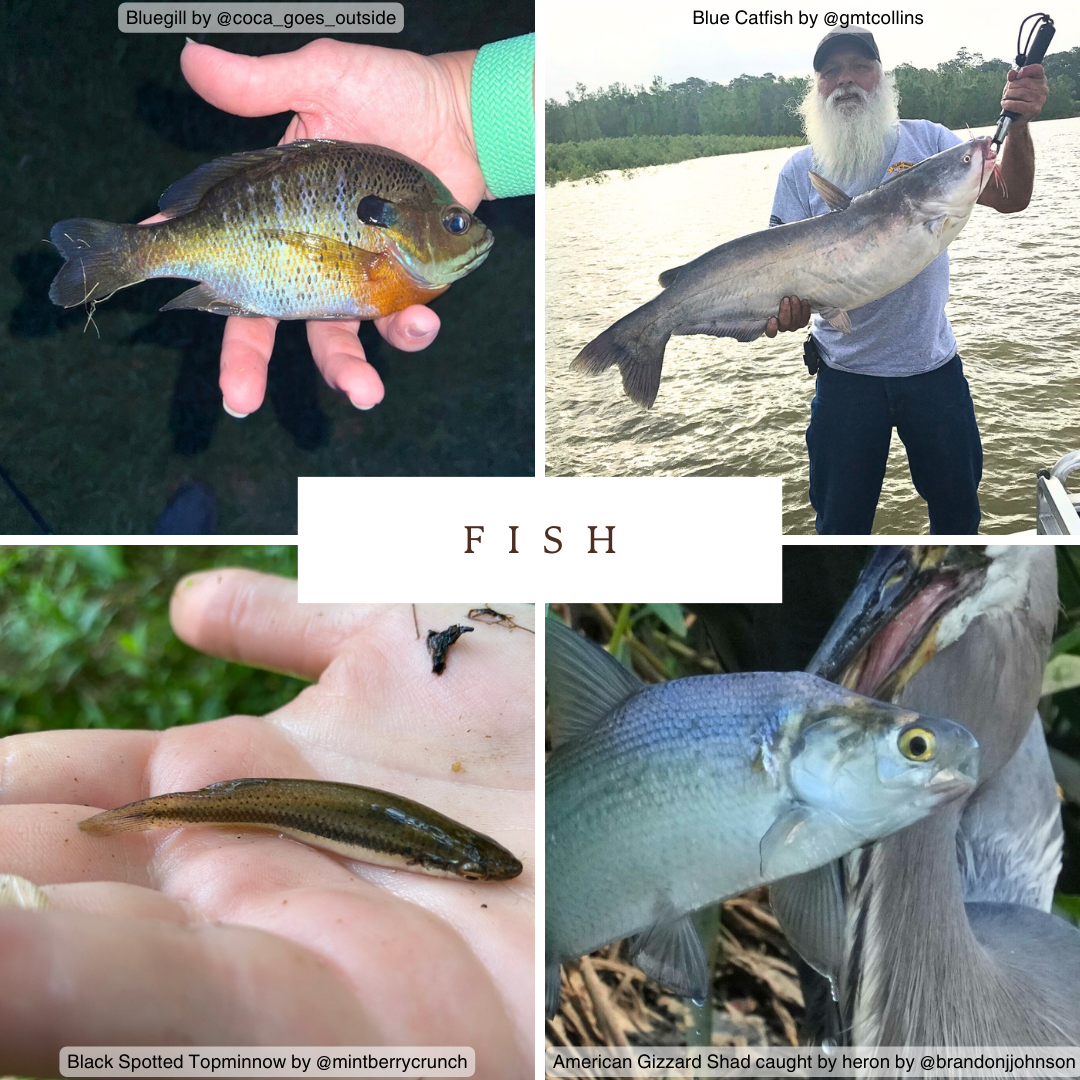
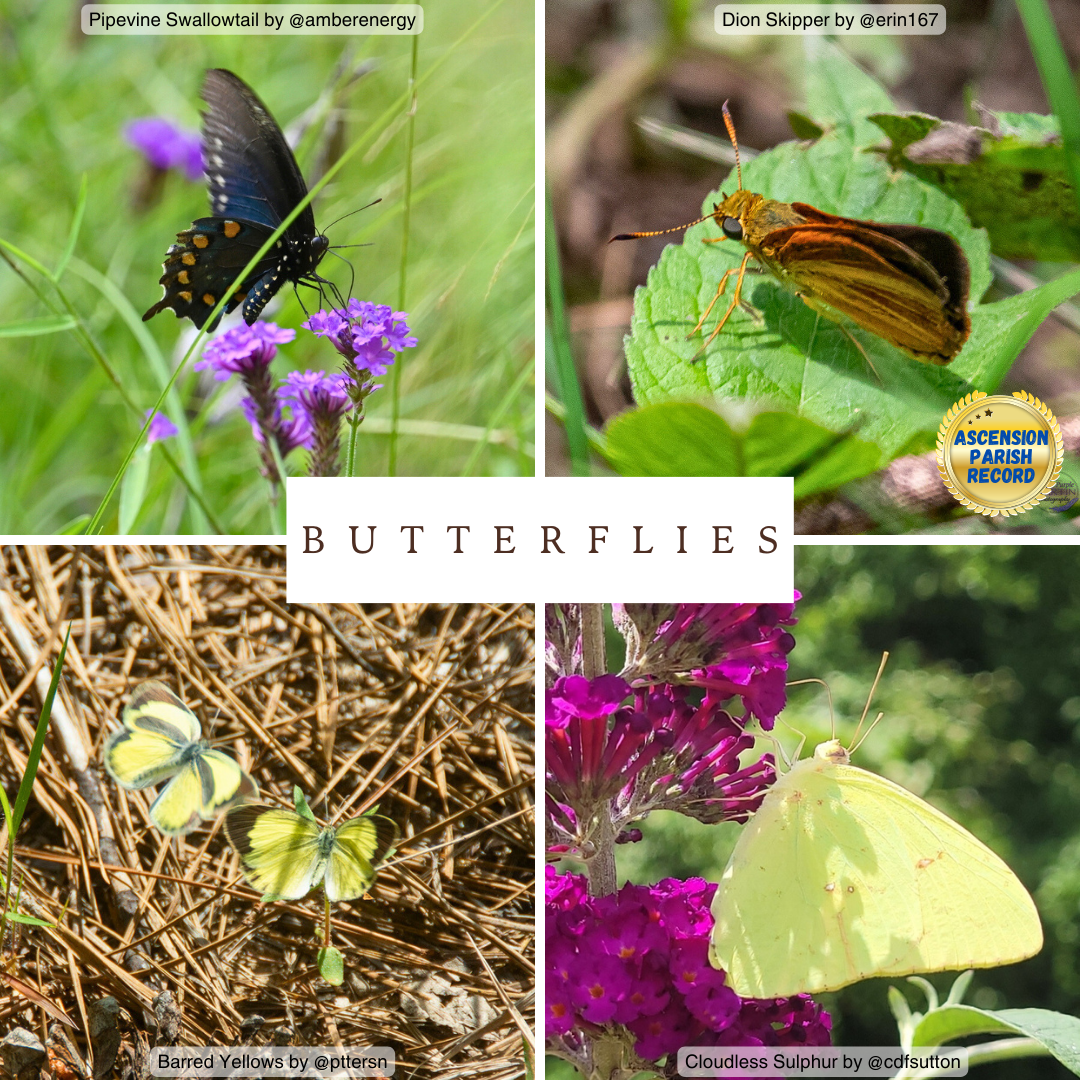
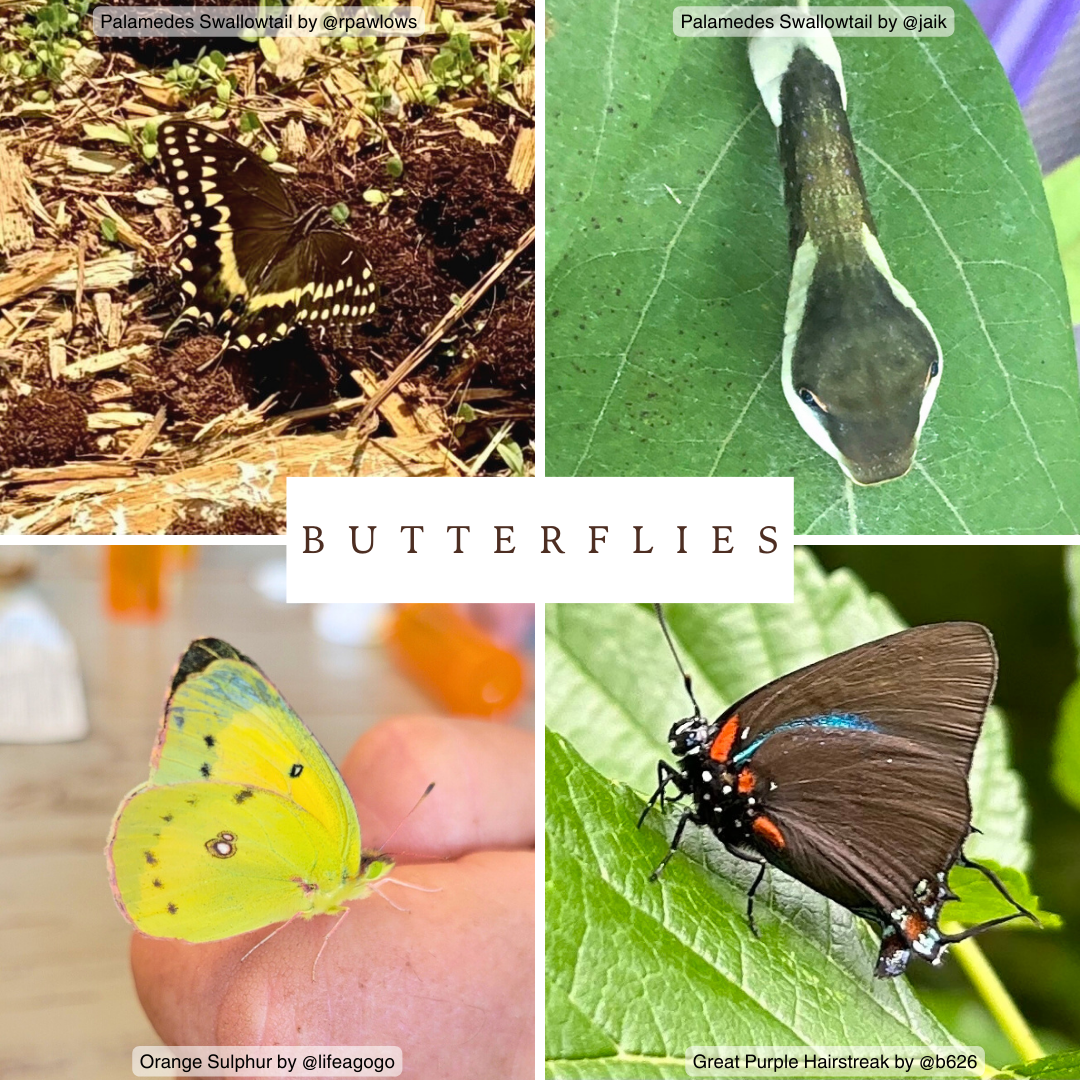
Most Observed Species in the Baton Rouge Region
Overall
Fall Webworm Moth Caterpillars
Blue Dasher Dragonfly
Virginia Creeper
Eastern Poison Ivy
Southern Dewberry
Mammals
(28 species observed)
Eastern Gray Squirrel
Common Raccoon
Swamp Rabbit
White-tailed Deer
Virginia Opossum
Amphibians
(19 species observed)
Cope’s Gray Treefrog
Green Treefrog
Squirrel Treefrog
Green/Bronze Frog
Gulf Coast Toad
Reptiles
(33 species observed)
Green Anole
Banded Watersnake
Pond Slider
Broad-headed Skink
Western Ribbon Snake
Butterflies
(43 species observed)
Pearl Crescent
Black Swallowtail
Common Buckeye
Little Wood Satyr
Dun Skipper
Moths
(319 species observed)
Fall Webworm Moth
Buck Moth
Waterlily Leafcutter Moth
Moonseed Moth
Forest Tent Caterpillar Moth
Other Arthropods
(745 species observed)
Blue Dasher
Great Blue Skimmer
Western Honey Bee
Eastern Pondhawk
Common Pill Woodlouse
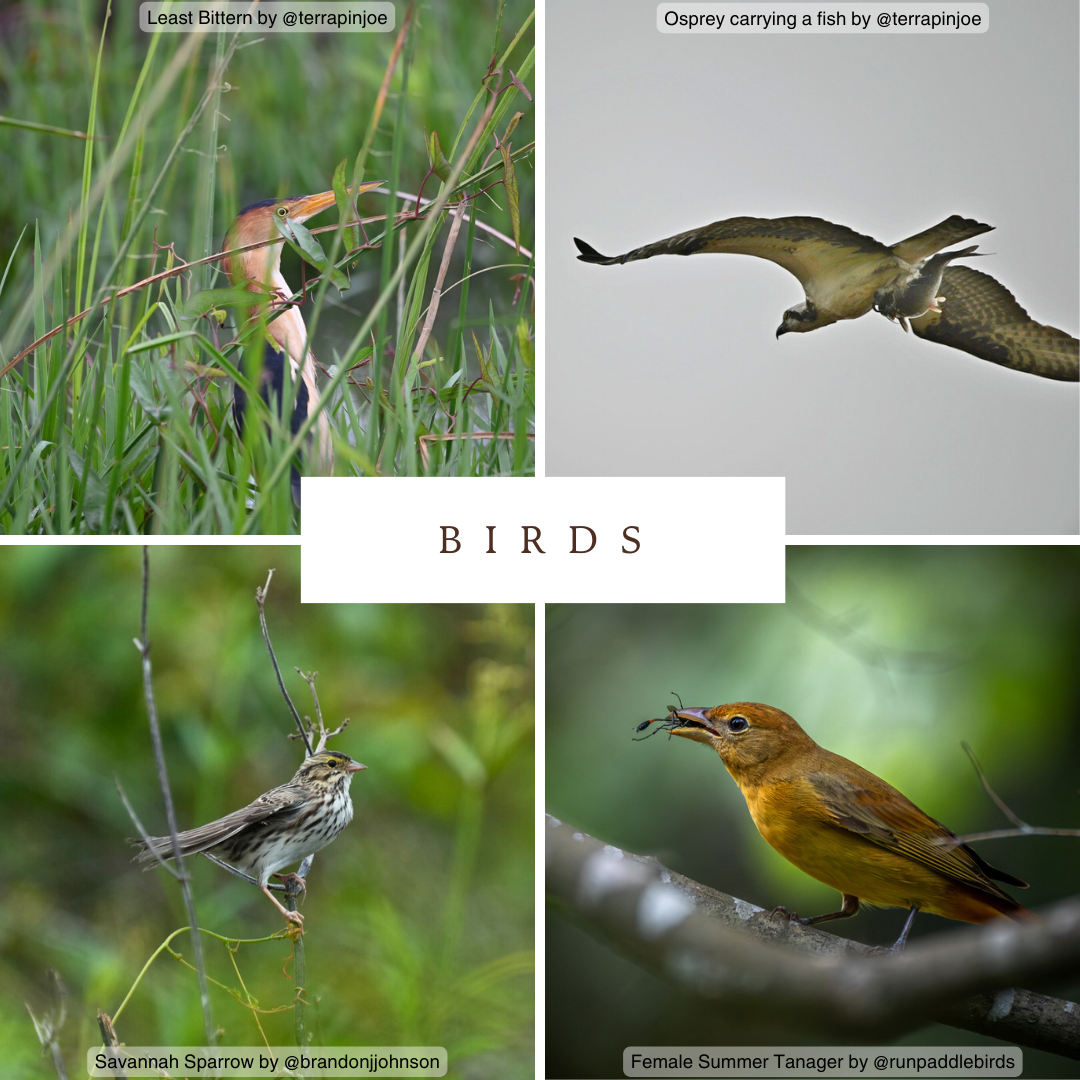
Birds
(118 species observed)
Northern Cardinal
Northern Mockingbird
Carolina Wren
Eastern Bluebird
Red-winged Blackbird
Plants (1,069 species observed)
Trees
American Sweetgum
Water Oak
Chinese Tallow
Southern Magnolia
Red Maple
Vines
Virginia Creeper
Eastern Poison Ivy
Muscadine
Peppervine
Japanese Climbing Fern
Other Plants
Southern Dewberry
Bristle Thistle
Largeflower Pink-Sorrel
Chinese Privet
Mock Strawberry
Fungi & Lichens
(156 species observed)
Latte Bracket
Christmas Lichen
Trametes cubensis bracket fungi
Crowded Parchment
Hairy Oyster Mushroom
Fish
(15 species observed)
Western Mosquitofish
Sailfin Molly
Bluegill
Eastern Mosquitofish
Western Blacktail Shiner
Local Leaderboard
Thank you to our participants, volunteers, partners and identifiers!
Most Observations
Brandon Johnson
Katrina Hashagen
Daniel Patterson
Carson Lambert
Alice Miller
Katherine Gividen
Erin Bryan
Janie Braud
Jody Shugart
Cindy Thompson
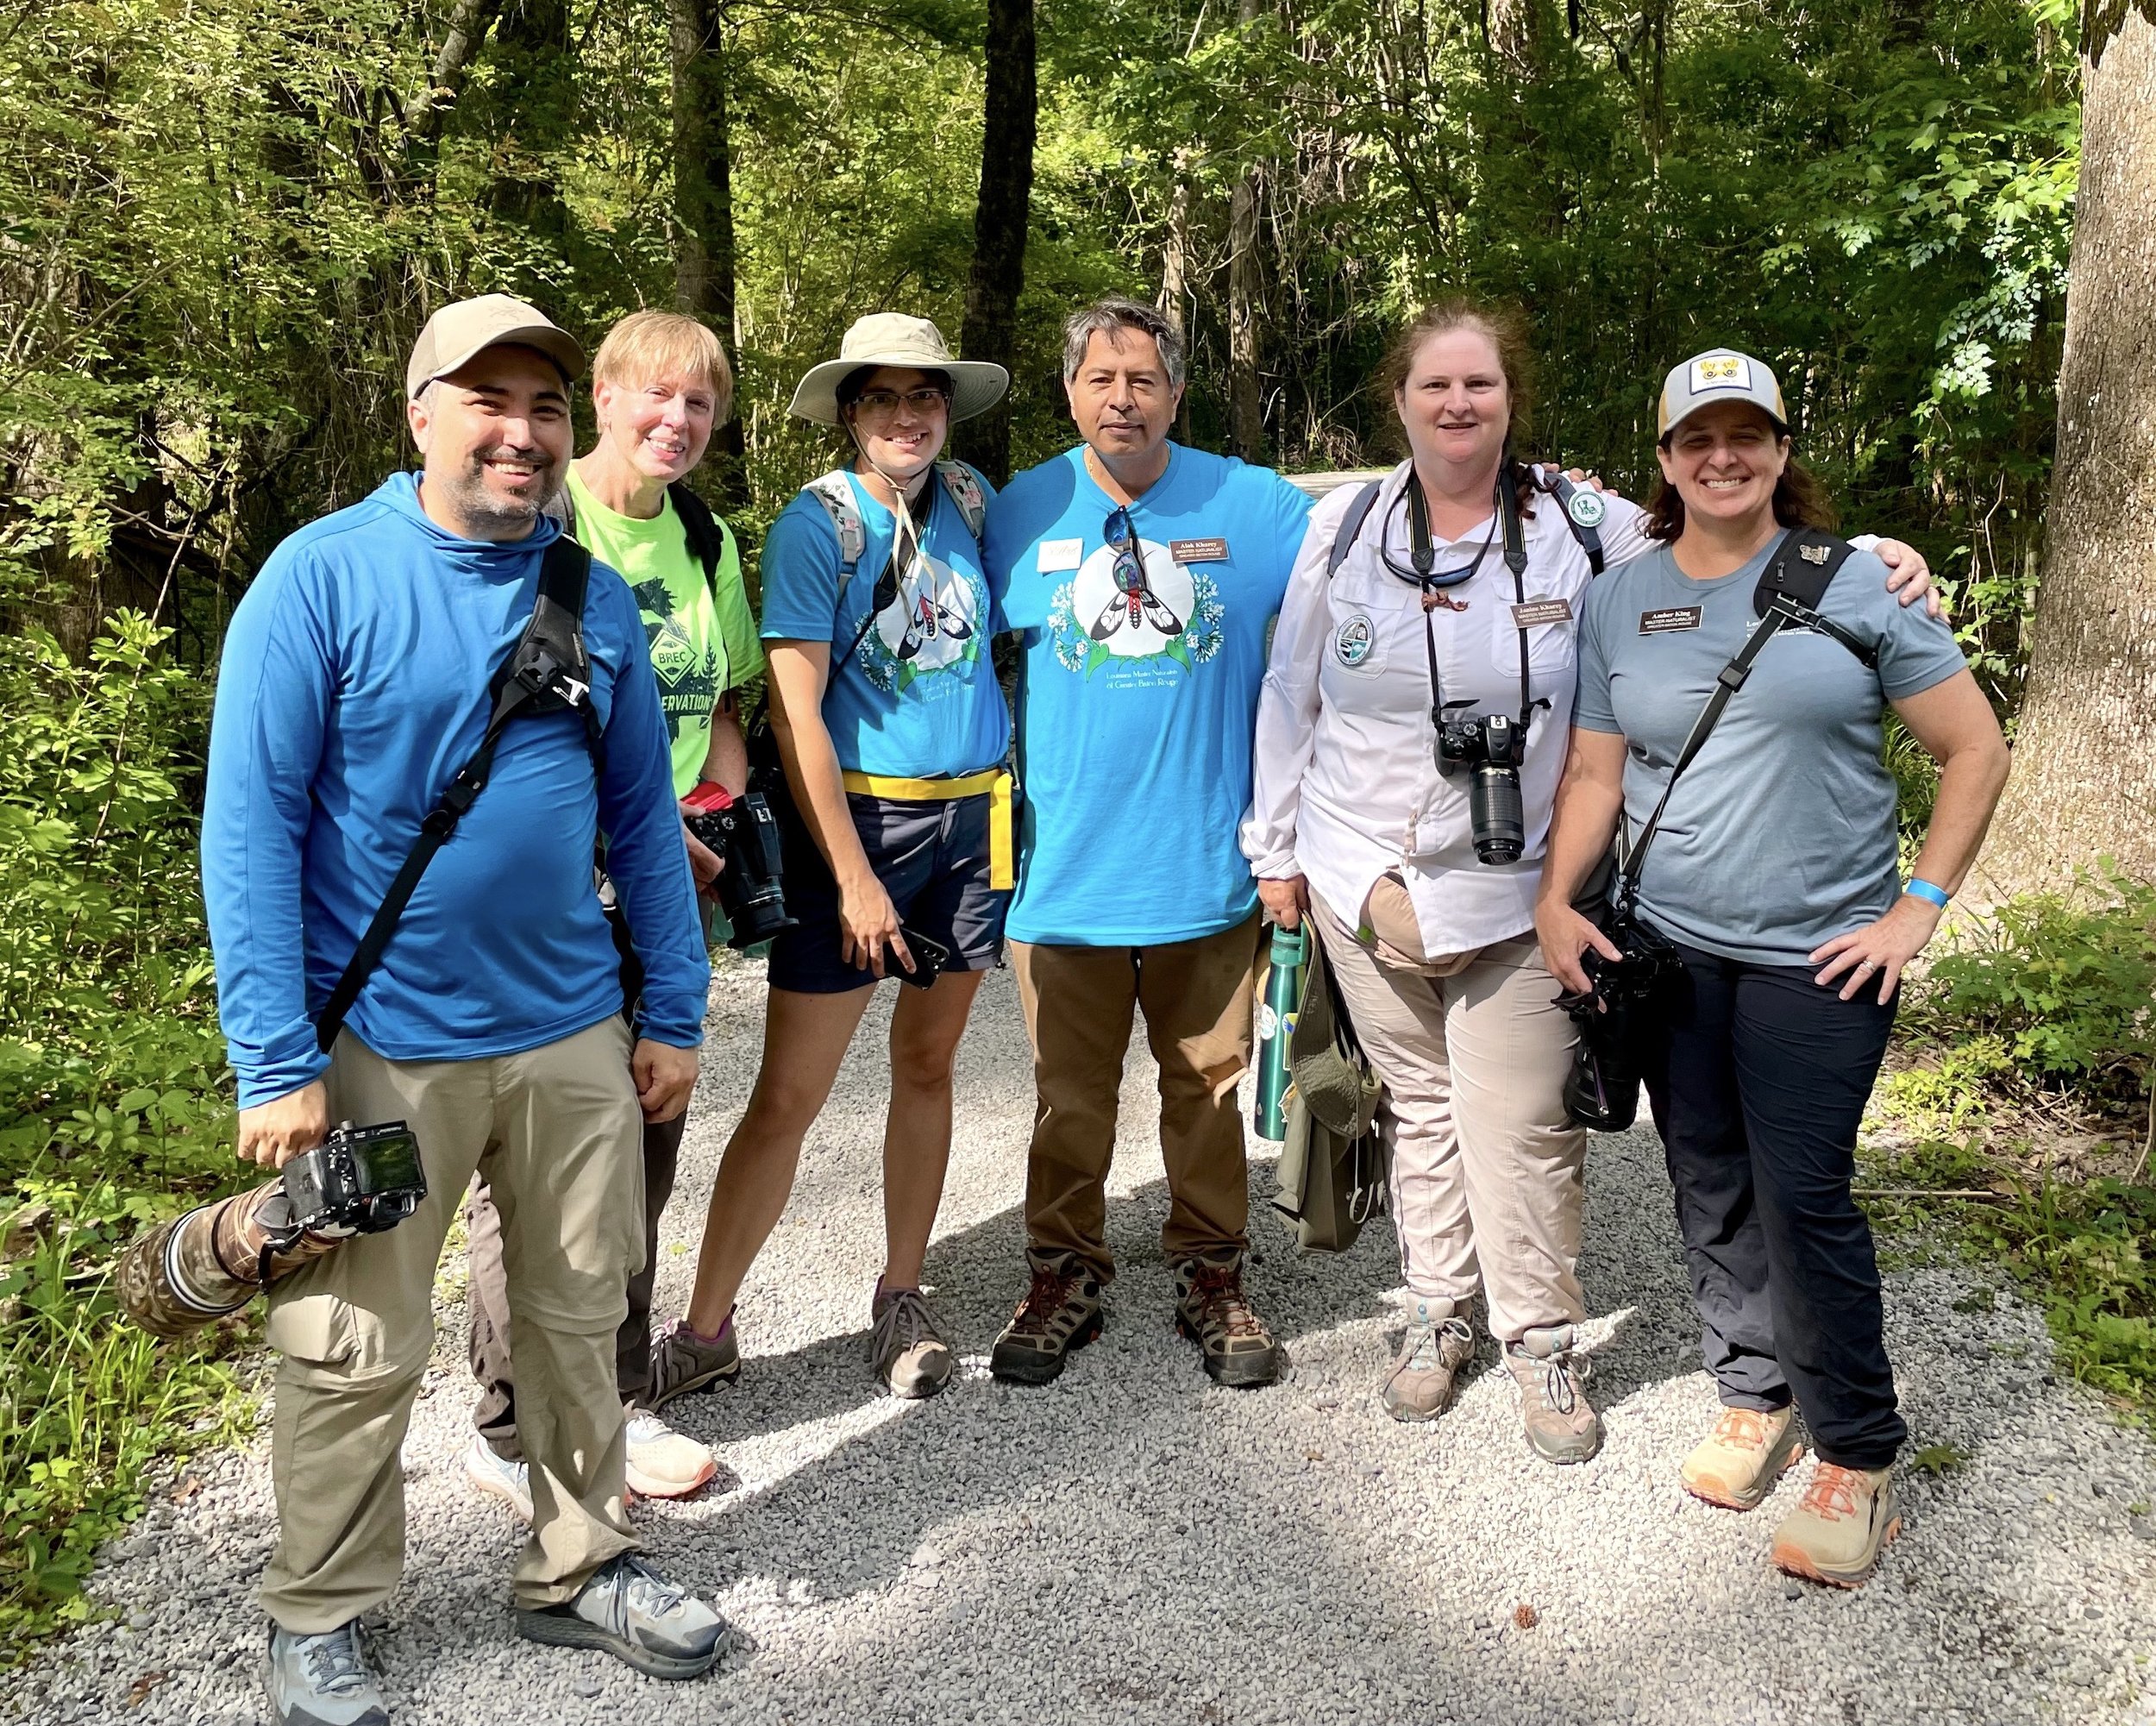
Pictured: #1 Brandon Johnson, far left, next to #8 Janie Braud, and #2 Katrina Hashagen with nature pals Alok & Janine Kharey and Amber King at the BREC BioBlitz at Bluebonnet Swamp Nature Center.
Most Species
Daniel Patterson
Katrina Hashagen
Brandon Johnson
Jody Shugart
Alice Miller
Erin Bryan
Carson Lambert
Katherine Gividen
Amber King
Janie Braud
Most Identifications
Katrina Hashagen
Daniel Patterson
Lisa Appelbaum
Janie Braud
Amber King
Ken Bosso
Sean Golden
Roger Butner
Brad Moon
Krista Adams
Observation Distribution
We had observations made in all 12 parishes of our region! Here are the 20 spots that had the most observations logged:
Observation Hot Spots
1. BREC Bluebonnet Swamp Nature Center
2. LSU AgCenter Botanic Gardens at Burden
3. Big Branch Marsh NWR & Lacombe area
4. LSU Hilltop Arboretum
5. Baton Rouge Audubon Society Amite River Wildlife Sanctuary
6. Tickfaw State Park & River
7. Tunica Hills WMA
8. BREC Highland Road Park & Observatory
9. Dawson Creek Trail & Perkins Road Park
10. Waddill Wildlife Refuge
11. Northlake Nature Center, Pelican Park & Fontainebleau State Park area
12. Joyce WMA
13. BREC Forest Community Park
14. Bogue Chitto National Wildlife Refuge
15. BREC Hooper Road Park
16. North Park, Denham Springs
17. BREC Bayou Manchac Park
18. BREC Frenchtown Conservation Area
19. Downtown BR & Capitol Lake
20. Bogue Chitto State Park
Observation Quality
Verifiable Observations
Observations with photo or audio evidence and the organism is wild (meaning not captive or cultivated.)
97.7%
We improved 4.7% on this important statistic, though our standing is still low, #375 in the world.
Research Grade
Verifiable observations that were able to be identified and can be used for scientific research.
48%
We dropped 4% on this statistic - something to work on! We placed #229 in the world for this statistic. This often means the organism in the photo was not clear enough to identify it.
Global City Nature Challenge Results
The overall winner is La Paz, Bolivia!
2,436,844
Observations Made
During the four day challenge
83,528
People Participated
From 51 countries
65,682+
Species Documented
Including 3,940+ rare, threatened, or endangered species
See all of the cities that participated
See the full leaderboard for all cities
2024 City Nature Challenge Infographic
See the global observations:
Global Leaderboard
Observations
La Paz, Bolivia
Monterrey, Mexico
San Antonio, TX
Cochabamba, Bolivia
Trinidad
Dallas/Fort Worth, TX
Houston, TX
Washington D.C.
Innsbruck, Austria
Cape Town, South Africa
San Francisco, CA
Hong Kong, China
Hyderabad, India
Tagum City, Philippines
São Paulo, Brazil
South Florida
San Diego County, CA
New York City, NY
Albuquerque, NM
Austin, TX
Los Angeles, CA
Chiayi-Yunlin, Taiwan
Philadelphia, PA
Salzburg, Austria
Milazzo, Italy
Ōtautahi/Christchurch, New Zealand
Brno, Czech Republic
Nanakmatta, India
Veseli nad Moravou, Czech Republic
Raleigh, NC
Te Upoko o te ika/Wellington, New Zealand
Berlin, Germany
Baton Rouge, LA
Durban, South Africa
Seattle-Tacoma Metropolitan Area, WA
Species
La Paz, Bolivia
Hong Kong, China
Innsbruck, Austria
Houston, TX
San Antonio, TX
Cochabamba, Bolivia
South Florida
Cape Town, South Africa
Dallas/Fort Worth, TX
San Francisco, CA
Washington D.C.
Monterrey, Mexico
Tagum City, Philippines
Trinidad
Austin, TX
San Diego County, CA
Los Angeles, CA
Chiayi-Yunlin, Taiwan
Baton Rouge, LA
Durban, South Africa
Raleigh, NC
Milazzo, Italy
São Paulo, Brazil
Te Upoko o te ika/Wellington, New Zealand
Botswana
Santa Cruz, Bolivia
Philadelphia, PA
Garden Route District, South Africa
Ōtautahi/Christchurch, New Zealand
Neusiedler See/Seewinkel, Austria
Berlin, Germany
Salzburg, Austria
Roma, Italy
Curitiba, Brazil
Ukraine
Participants
La Paz, Bolivia
Monterrey, Mexico
San Francisco, CA
Los Angeles, CA
Trinidad
Washington D.C.
Houston, TX
Austin, TX
Dallas/Fort Worth, TX
Boston, MA
San Antonio, TX
San Diego County, CA
Cape Town, South Africa
Raleigh, NC
Philadelphia, PA
Chicago, IL
New York City, NY
Cochabamba, Bolivia
Hong Kong, China
Tagum City, Philippines
Seattle-Tacoma Metropolitan Area, WA
Montreal, Canada
Melbourne, Australia
South Florida
Baltimore, MD
Atlanta, GA
Asheville, NC
Toronto and GTA, Canada
Sacramento, CA
San Bernardino, CA
Pittsburgh, PA
Monterey & Pacific Grove, CA
Brno, Czech Republic
Hyderabad, India
Santa Cruz, Bolivia
…
52. Baton Rouge, LA
Comparison by Similar population
Competing Regions with populations 1 Million - 2.5 million
111 competitors
Observations
La Paz, Bolivia
Monterrey, Mexico
Cochabamba, Bolivia
Austin, TX
Chiayi-Yunlin, Taiwan
Raleigh, NC
Baton Rouge, LA
Vancouver, Canada
Montreal, Canada
Calgary, Canada
Species
La Paz, Bolivia
Cochabamba, Bolivia
Monterrey, Mexico
Austin, TX
Chiayi-Yunlin, Taiwan
Baton Rouge, LA
Raleigh, NC
Asheville, NC
Quito, Ecuador
Pittsburgh, PA
Participants
La Paz, Bolivia
Monterrey, Mexico
Austin, TX
Raleigh, NC
Cochabamba, Bolivia
Montreal, Canada
Asheville, NC
Pittsburgh, PA
Vancouver, Canada
Knoxville, TN
Norwalk, CT
Baton Rouge, LA
Comparison by similar area
Competing Regions 10,000-25,000 square kilometers
64 competitors
Observations
Dallas/Fort Worth, TX
Washington D.C.
San Francisco, CA
San Diego County, CA
Albuquerque, NM
Austin, TX
Los Angeles, CA
Baton Rouge, LA
Seattle-Tacoma Metropolitan Area, WA
Greater Boston, MA
Species
Dallas/Fort Worth, TX
San Francisco, CA
Washington D.C.
Austin, TX
San Diego County, CA
Los Angeles, CA
Baton Rouge, LA
Santa Cruz, Bolivia
Curitiba, Brazil
Lower Rio Grande Valley, TX
Participants
San Francisco, CA
Los Angeles, CA
Washington D.C.
Austin, TX
Dallas/Fort Worth, TX
Boston, MA
San Diego County, CA
Chicago, IL
Seattle-Tacoma Metropolitan Area, WA
Sacramento, CA
Pittsburgh, PA
Monterey & Pacific Grove, CA
Santa Cruz, Bolivia
Albuquerque, NM
Saint Louis, MO
Sydney, Australia
Baton Rouge, LA
Thank you to our amazing partners!


